Are Commodities Entering a New Supercycle?
See how long-run commodity cycles have shifted from 1900 to 2025, and why rising real commodity trends may matter for investors in 2026.
Published
November 19, 2026 8:51 am
By
Design
- Abha Patil
The following content is sponsored by Global X Canada
Are Commodities Entering a New Supercycle?
Key Takeaways
The real Bank of Canada Commodity Price Index (BCPI) All Commodities trend rose 1.13 points from 2023 to 2025, suggesting commodities may be entering a renewed upswing.
Energy posted the largest move, rising 7.72 points from 2023 to 2025, while Metals & Minerals gained 1.98 points over the same period.
Commodity supercycles are multi-decade swings in real prices above or below their long-run trend. They help investors understand when the commodity pendulum may be shifting back toward long-term opportunities.
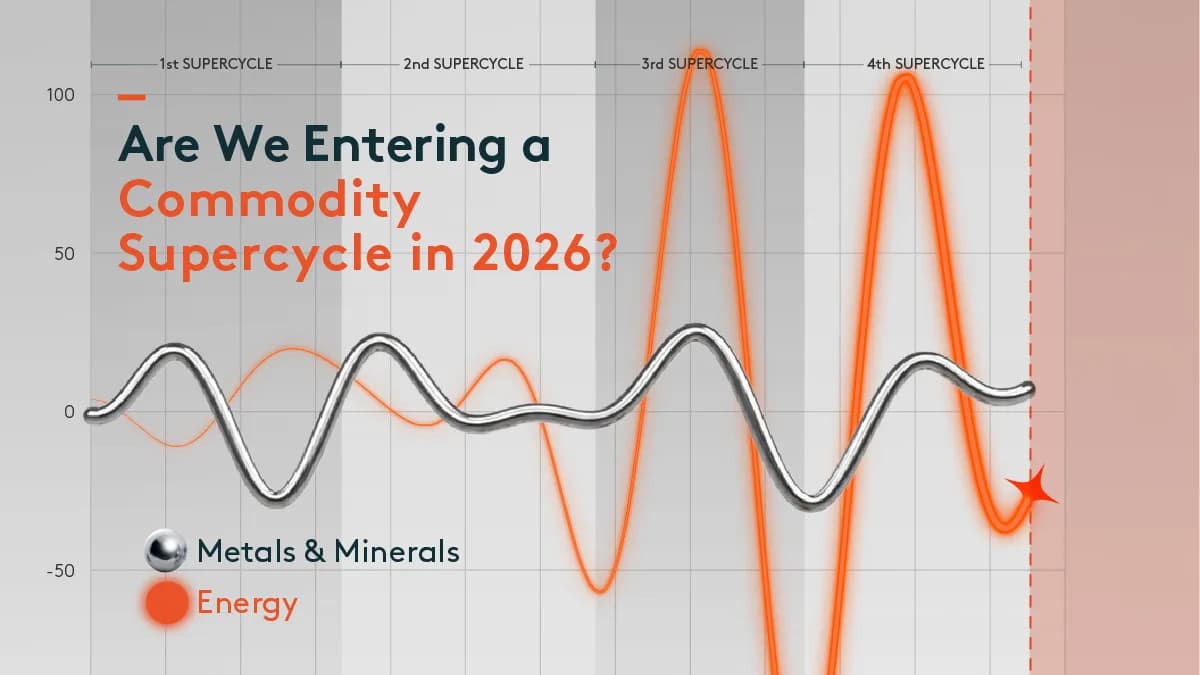
This graphic, in partnership with Global X Canada, is the final graphic in the Investing in Commodities series. It visualizes the Bank of Canada Commodity Price Index, including All Commodities, Energy, and Metals & Minerals, using data from Statistics Canada and Visual Capitalist calculations.
The Next Commodity Upswing
The real BCPI All Commodities trend reached a recent low in 2023 before rising in both 2024 and 2025. That inflection suggests commodity prices may be starting a new upward phase.
YearBCPI, Total, All CommoditiesEnergyMetals & Minerals
1900-7.330.69-3.83
1901-6.320.42-3.94
1902-4.92-0.30-3.19
1903-3.12-1.45-1.65
1904-0.94-2.990.57
19051.56-4.823.30
19064.34-6.816.31
19077.30-8.829.34
190810.34-10.7012.14
190913.34-12.2814.44
191016.16-13.4315.99
191118.69-14.0316.61
191220.79-14.0116.17
191322.35-13.3114.61
191423.25-11.9611.93
191523.43-10.008.24
191622.84-7.513.70
191721.46-4.63-1.46
191819.30-1.50-6.95
191916.431.73-12.48
192012.914.90-17.71
19218.887.87-22.35
19224.4710.52-26.11
1923-0.1612.75-28.76
1924-4.8314.50-30.15
1925-9.3715.73-30.19
1926-13.6216.45-28.88
1927-17.4116.69-26.29
1928-20.6016.48-22.57
1929-23.1015.88-17.93
1930-24.8214.96-12.65
1931-25.7113.77-7.02
1932-25.7712.36-1.34
1933-25.0210.784.08
1934-23.529.078.97
1935-21.347.2413.10
1936-18.605.3316.30
1937-15.423.3618.46
1938-11.921.3619.52
1939-8.24-0.6119.53
1940-4.51-2.5018.56
1941-0.86-4.2216.77
19422.62-5.6814.32
19435.82-6.7811.43
19448.67-7.408.31
194511.09-7.465.18
194613.06-6.882.22
194714.53-5.65-0.40
194815.50-3.77-2.57
194915.96-1.34-4.21
195015.921.51-5.30
195115.394.57-5.86
195214.407.58-5.95
195312.9910.24-5.66
195411.1812.21-5.10
19559.0313.18-4.40
19566.6112.86-3.67
19573.9611.02-3.03
19581.197.52-2.55
1959-1.632.35-2.30
1960-4.39-4.39-2.29
1961-6.98-12.43-2.50
1962-9.29-21.39-2.91
1963-11.21-30.73-3.42
1964-12.62-39.83-3.94
1965-13.43-48.00-4.36
1966-13.55-54.54-4.56
1967-12.94-58.76-4.45
1968-11.57-60.08-3.93
1969-9.45-58.03-2.94
1970-6.63-52.34-1.45
1971-3.20-42.970.54
19720.69-30.102.97
19734.89-14.185.77
19749.194.108.80
197513.3823.8411.92
197617.2244.0014.96
197720.4863.3917.73
197822.9780.8220.06
197924.4995.1221.77
198024.90105.2822.72
198124.13110.4522.80
198222.13110.0621.93
198318.95103.8720.08
198414.6891.9417.29
19859.5074.7313.62
19863.6353.019.20
1987-2.6827.844.19
1988-9.120.54-1.20
1989-15.38-27.43-6.75
1990-21.15-54.52-12.22
1991-26.13-79.23-17.37
1992-30.08-100.14-21.98
1993-32.78-116.09-25.84
1994-34.10-126.16-28.78
1995-33.97-129.79-30.68
1996-32.40-126.81-31.46
1997-29.47-117.43-31.11
1998-25.33-102.22-29.65
1999-20.20-82.10-27.18
2000-14.35-58.27-23.84
2001-8.06-32.10-19.81
2002-1.66-5.08-15.28
20034.5521.28-10.48
200410.2745.57-5.66
200515.2566.56-1.02
200619.2983.253.23
200722.2594.936.92
200824.03101.259.91
200924.64102.1612.12
201024.1297.9813.51
201122.5989.2914.10
201220.2076.9013.95
201317.1661.8313.17
201413.6945.1511.87
201510.0227.9710.23
20166.3611.338.42
20172.91-3.856.60
2018-0.15-16.844.93
2019-2.70-27.123.55
2020-4.65-34.402.55
2021-5.97-38.642.01
2022-6.67-40.011.96
2023-6.79-38.872.37
2024-6.42-35.723.19
2025-5.66-31.154.35
Visual Capitalist calculations for 2015 – 2025 trends.
Supercycles are typically measured trough to trough, lasting roughly 30 years. Based on this framework, past commodity cycles were:
1899-1932: 1st Super Cycle (33 years)
1933-1967: 2nd Super Cycle (34 years)
1968 – 1995: 3rd Super Cycle (27 years)
1996 – 2023(?): 4th Super Cycle (27 years)
If 2023 is confirmed as a trough, it could represent an inflection point in the long-term commodity cycle. However, whether this marks the beginning of a new supercycle remains uncertain.
Energy and Metals Tell Different Stories
Energyhas historically shown the largest swings in the dataset. Its sharp moves create both risk and opportunity, especially as energy markets respond to demand growth, supply constraints, and geopolitical shocks.
Metals & Minerals have moved more steadily in recent years. This reflects rising demand from electrification, infrastructure, defense, and industrial growth.
Investing in Commodities
The real BCPI trend rising in 2024 and 2025 signals renewed upward momentum in commodity prices, making the asset class more relevant for investors in 2026.
Commodity ETFs can offer diversified access without selecting individual producers. As energy and metals move through long-term cycles, Global X Canada’s ETFs may help investors position around broad commodity trends.
To learn more, explore the Global X All-In-One Commodity Producers Equity ETF (COMX), which provides diversified exposure to commodity producers across precious metals, energy and base metals.
Commissions, management fees, and expenses all may be associated with an investment in products (the “Global X Funds”) managed by Global X Investments Canada Inc. The Global X Funds are not guaranteed, their values change frequently and past performance may not be repeated. Certain Global X Funds may have exposure to leveraged investment techniques that magnify gains and losses which may result in greater volatility in value and could be subject to aggressive investment risk and price volatility risk. Such risks are described in the prospectus. The prospectus contains important detailed information about the Global X Funds. Please read the relevant prospectus before investing.
Certain statements may constitute a forward-looking statement, including those identified by the expression “expect” and similar expressions (including grammatical variations thereof). The forward-looking statements are not historical facts but reflect the author’s current expectations regarding future results or events. These forward-looking statements are subject to a number of risks and uncertainties that could cause actual results or events to differ materially from current expectations. These and other factors should be considered carefully and readers should not place undue reliance on such forward-looking statements. These forward-looking statements are made as of the date hereof and the authors do not undertake to update any forward-looking statement that is contained herein, whether as a result of new information, future events or otherwise, unless required by applicable law.
This communication is intended for informational purposes only and does not constitute an offer to sell or the solicitation of an offer to purchase investment products (the “Global X Funds”) managed by Global X Investments Canada Inc. and is not, and should not be construed as, investment, tax, legal or accounting advice, and should not be relied upon in that regard. Individuals should seek the advice of professionals, as appropriate, regarding any particular investment. Investors should consult their professional advisors prior to implementing any changes to their investment strategies. These investments may not be suitable to the circumstances of an investor.
All comments, opinions and views expressed are generally based on information available as of the date of publication and should not be considered as advice to purchase or to sell mentioned securities. Before making any investment decision, please consult your investment advisor or advisors.
Global X Investments Canada Inc. (“Global X”) is a wholly owned subsidiary of Mirae Asset Global Investments Co., Ltd. (“Mirae Asset”), the Korea-based asset management entity of Mirae Asset Financial Group. Global X is a corporation existing under the laws of Canada and is the manager, investment manager and trustee of the Global X Funds.
You may also like
- Markets3 days ago The Top Drivers of Silver Demand by Sector, 2016-2026 See the top drivers of silver demand by sector from 2016 to 2026, led by industrial uses and physical investment demand.
- Markets4 months ago Silver vs. Gold: Annual Returns During Downturns See how silver and gold returns compare during recessions and downturns, and why silver’s larger swings can create both risk and opportunity.
- Economy4 months ago What are the Largest Commodity Companies in North America? See the largest commodity companies in North America by market cap and production, led by ExxonMobil’s dominance in oil and gas.
- Economy5 months ago Charted: How Many Years of Supply Life Are Left for Commodities? Rare earth metals have lost the most supply life in the last five years from 2020 to 2025. How much supply is left for other commodities?
- Mining5 months ago Ranked: Which Countries Produce the Most Silver? Mexico is the leading silver producer with 20% of global production in 2025, the most silver produced of any country. Which country follows?
- Space6 months ago The Largest Public Space Companies by Country Rocket Lab leads the public pure-play space companies, with a C$71.4 billion market cap exceeding the next five companies combined.
- Space6 months ago Who Owns the Most Satellites? SpaceX has the most operational satellites in the world, with Starlink’s scale showing how commercial networks now shape orbital infrastructure.
- Economy7 months ago The Fastest Growing Space Economy Sectors by 2035 The space economy is set to reach C$2.5T by 2035, with supply chains, food, and defense leading growth in space-enabled industries.
Subscribe
Get the latest news delivered to your inbox.
Related articles