
Charted: The Three Waves of the U.S. Trade Deficit (1990–2026)
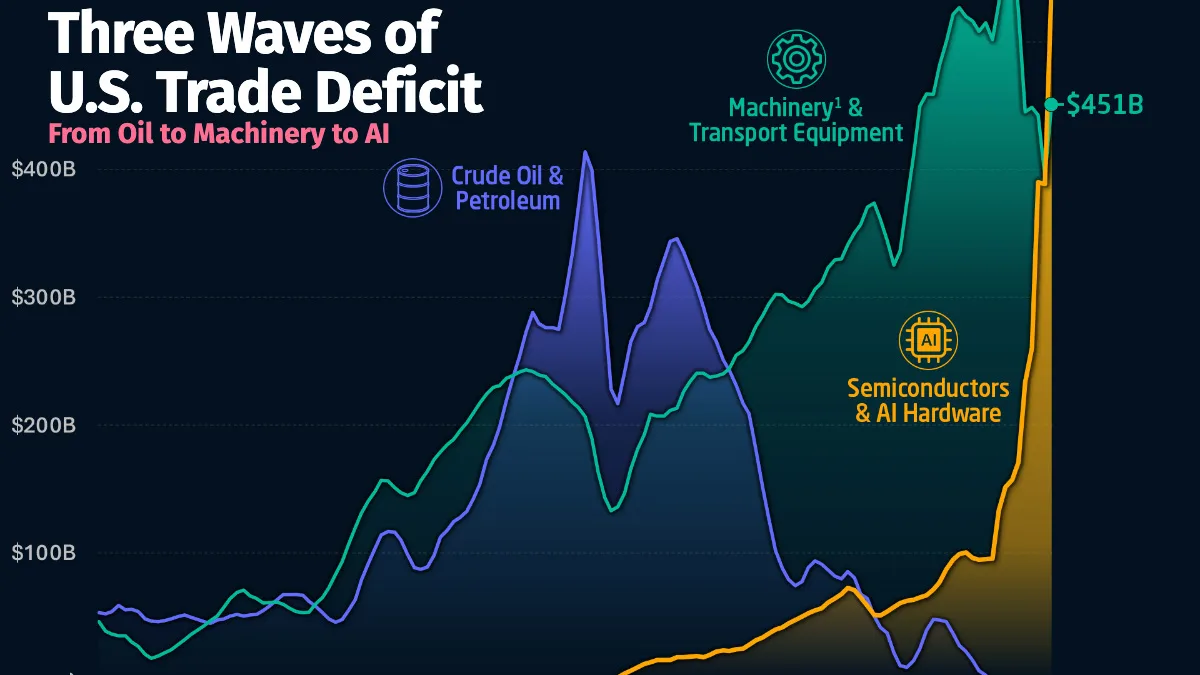
The U.S. trade deficit in semiconductors and AI hardware hit an annualized $546 billion in Q2 2026, overtaking machinery and oil's 2008 peak.
How America’s Trade Deficit Shifted From Oil to AI
Key Takeaways
The U.S. trade deficit in semiconductors and AI hardware reached an annualized $546 billion in the second quarter of 2026, more than double its level a year earlier.
That surpassed both the machinery and transport equipment deficit ($451 billion) and the oil deficit’s 2008 peak ($414 billion).
Over the past 35 years, America’s trade deficit has undergone three major shifts, from oil and petroleum to machinery and transport equipment, and now the chips and servers powering artificial intelligence.
The latest wave has grown at an extraordinary pace. Since 2020, the U.S. trade deficit in semiconductors and AI hardware has increased more than ninefold, reflecting surging demand for imported computing equipment.
This graphic tracks the annualized U.S. trade deficit across three product categories from 1990 to the second quarter of 2026, using data from the U.S. Census Bureau and the U.S. International Trade Commission.
Semiconductors and AI Hardware Are the Third Wave
The deficit in semiconductors and AI hardware barely registered before 2010, but the category has since become a major driver of America’s goods trade imbalance.
Imports are driving the widening gap. In the first seven months of 2026, the U.S. imported $429 billion of semiconductors and AI hardware, compared with $132 billion in exports.
The table below shows the annualized deficit in each category in the second quarter of every sixth year since 1990:
CategoryAnnualized U.S. Trade Deficit (USD, Billions)
1990199620022008201420202026
Crude Oil & Petroleum52.255.087.0370.8231.221.8
Machinery & Transport Equipment38.960.9156.4213.8254.5325.1451.2
Semiconductors & AI Hardware24.557.8545.7
Annualized quarterly rates. Blank cells mean the category was not tracked separately or the U.S. ran a surplus. Machinery includes mechanical machinery and electrical and electronic equipment.
America’s AI infrastructure boom is a major driver of this shift. As technology companies build increasingly powerful data centers, demand for imported servers, chips, and computing equipment has surged.
According to the BEA, U.S. imports of computers increased by $101.4 billion in 2025, while imports of computer accessories rose by another $42.7 billion amid the AI buildout. The broader hardware category also includes equipment used outside AI applications.
Much of this hardware has also avoided tariffs. Computers and chips were exempted from reciprocal tariffs in April 2025, while a 2026 tariff on certain advanced chips does not apply to those imported for use in U.S. data centers.
Oil’s Deficit Disappeared as U.S. Production Boomed
The first wave of America’s oil deficit peaked at an annualized $414 billion in the third quarter of 2008, when oil prices spiked. Shale drilling then transformed U.S. production, and in 2020 the country became a net petroleum exporter for the first time since at least 1949.
By 2024, the oil deficit had disappeared from the chart, reflecting America’s declining dependence on OPEC oil. Machinery and transport equipment had already become the second wave, with its deficit reaching a peak of $575 billion in late 2024.
As a share of GDP, the machinery deficit has remained near 1.5% since the early 2000s, growing roughly in step with the economy.
The table below shows each category’s deficit as a share of U.S. GDP every sixth year since 1990:
CategoryU.S. Trade Deficit as a Share of GDP (%)
1990199620022008201420202026
Crude Oil & Petroleum0.90.70.82.51.30.1
Machinery & Transport Equipment0.70.81.51.51.51.51.4
Semiconductors & AI Hardware--------0.10.31.7
Annualized quarterly rates. Blank cells mean the category was not tracked separately or the U.S. ran a surplus. The oil deficit peaked at 2.8% of GDP in the third quarter of 2008.
While the semiconductor and AI hardware deficit has surpassed oil’s historic peak in dollar terms, the picture changes when adjusted for the size of the economy.
The latest deficit represents 1.7% of U.S. GDP, compared with 2.8% at the height of the oil deficit in 2008. America’s newest trade imbalance is larger in dollars, but oil’s peak was greater relative to the size of the economy.
Learn More on the Voronoi App
If you enjoyed today’s post, check out Ranked: America’s $425B Trade Deficit by Product (Q1 2025) on Voronoi.
Related articles
Mapped: Unemployment Rates in Every U.S. State in 2026
The U.S. has nearly four percent unemployment in 2026. West Coast states like California drive up the national average.

Ranked: 125 European Cities by Quality of Life and Cost
Which European cities offer the best quality of life for the lowest cost? Explore 125 cities ranked by affordability and livability.

Mapped: What a Home Is Worth in Every U.S. State in 2026
A typical home in Hawaii is worth $833,000, more than four times one in West Virginia. See how home values compare in every U.S. state.
How New York Property Prices Compare Around the World
How expensive is New York real estate? See how much property the same money buys in 65 other cities worldwide.
Which Country Is Actually the World’s Richest?
Switzerland, Singapore, and Norway each lead a different measure of GDP per capita after adjusting for prices and working hours.
Mapped: Unemployment Rates Across Europe in 2026
Explore unemployment rates across Europe in 2026, from Finland and Spain's high joblessness to the countries with the lowest rates.