
Marriage vs. Divorce Rates, by U.S. State
From marriage to divorce, explore how relationship trends vary across all 50 states and D.C.
This story was prepared automatically by software.
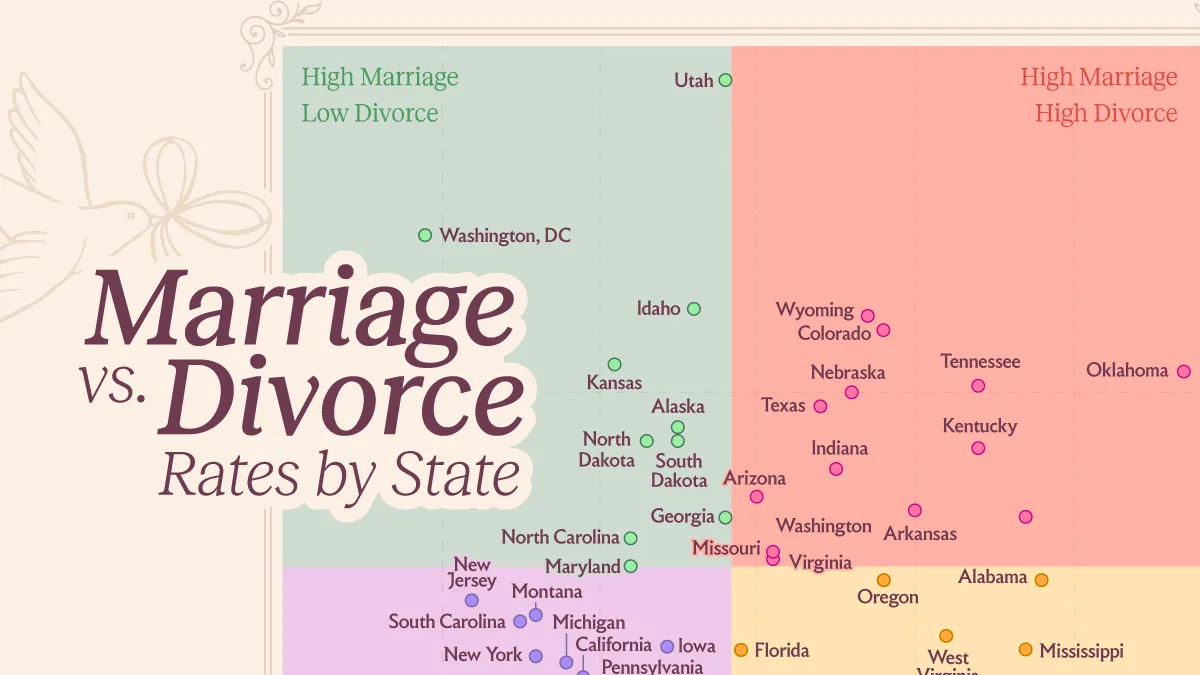
How Marriage and Divorce Rates Compare Across U.S. States
Key Takeaways:
Utah had America’s highest marriage rate in 2024, at 24.5 marriages per 1,000 residents aged 15 and older.
Oklahoma recorded the highest divorce rate, at 9.7 per 1,000, while Washington, D.C. had the lowest at 4.9.
High marriage rates don’t necessarily mean high divorce rates, with states showing very different patterns.
Where are Americans most likely to get married or divorced?
The answer reveals striking differences between states, including places where both marriage and divorce are relatively common and others where both are comparatively rare.
This graphic uses the U.S. Census Bureau’s 2024 American Community Survey, via USAFacts, to compare marriages and divorces reported over the previous 12 months per 1,000 residents aged 15 and older.
Marriage and Divorce Don’t Always Move Together
The table below shows 2024 marriage and divorce rates across all 50 states and Washington, D.C., based on Census Bureau data.
StateDivorce rateMarriage rateGap
Utah6.824.517.7
Washington, DC4.922.117.1
Idaho6.621.214.7
Kansas6.120.414.2
Wyoming7.721.113.3
Colorado7.820.913.1
North Dakota6.319.313.0
Alaska6.519.513.0
South Dakota6.519.312.9
Nebraska7.620.012.4
Texas7.419.812.4
New Jersey5.217.011.7
North Carolina6.217.911.7
Tennessee8.420.111.6
Arizona7.018.511.5
Georgia6.818.211.4
Indiana7.518.911.4
Maryland6.217.511.3
South Carolina5.516.711.2
Montana5.616.811.2
Washington7.418.411.0
Kentucky8.419.210.8
Missouri7.117.710.6
New York5.616.210.6
Oklahoma9.720.310.6
Virginia7.117.610.4
Michigan5.816.110.3
Arkansas8.018.310.3
California5.915.910.0
Connecticut5.615.610.0
Iowa6.416.39.9
Pennsylvania6.215.89.6
Minnesota5.915.49.5
Oregon7.817.39.5
Nevada8.718.29.5
Wisconsin5.615.09.4
Florida6.916.39.4
Ohio6.515.89.3
Illinois5.915.19.2
Massachusetts6.315.49.1
Hawaii5.814.89.1
New Mexico5.814.48.6
Alabama8.817.38.5
West Virginia8.216.58.4
Louisiana7.215.28.0
Rhode Island5.113.18.0
Mississippi8.716.37.6
Maine5.311.96.6
New Hampshire8.114.05.9
Delaware8.211.93.8
Vermont7.110.83.7
Utah leads with 24.5 marriages per 1,000 residents, followed by Washington, D.C. at 22.1 and Idaho at 21.2. At the other extreme, Vermont has the lowest marriage rate at 10.8 per 1,000.
The chart reveals different patterns across states. Utah and Idaho combine high marriage rates with relatively low divorce rates, while Oklahoma and Tennessee have high rates of both. This highlights how marriage and divorce rates can tell different stories about family formation across the country.
Utah and D.C. Have Very Different Marriage Patterns
Utah and Washington, D.C. have the country’s two highest marriage rates, but they represent very different marriage patterns.
Utah stands out for how young people marry. In 2024, the median age at first marriage was 25.2 for women, the youngest in the country, while Utah men tied with Arkansas for the youngest median age at 27.2.
Religion may also be part of Utah’s broader marriage culture. Utah has a large Latter-day Saint population and ranks among America’s most religious states. Together, its younger marriage ages and distinctive religious makeup provide useful context for Utah’s unusually high marriage rate, although the state-level data cannot establish a causal relationship.
D.C. presents a very different picture. Women there had the country’s oldest median age at first marriage in 2024, at 32.3, even as D.C. recorded the second-highest annual marriage rate. Just 44.9% of D.C. residents had ever been married, the lowest share nationwide.
Older States Tend to Have Longer-Running Marriages
Population age can also shape how marriage statistics look across states. Vermont and Maine have some of America’s longest-running marriages, with median durations of 22.6 and 22.5 years, respectively.
They also have the country’s two oldest populations, with median ages of 43.9 in Vermont and 44.9 in Maine. Their older populations help put those longer marriage durations into context.
Divorce Rates Are Higher Across Much of the South
Oklahoma recorded 9.7 divorces per 1,000 residents aged 15 and older in 2024, nearly twice Washington, D.C.’s rate of 4.9. Alabama, Mississippi, and Tennessee also appear toward the high end of the chart.
These figures measure annual divorces relative to the population aged 15 and older, rather than the share of marriages that eventually end in divorce. Differences in population age and the proportion of residents who are married can therefore influence state rankings.
The broader Southern pattern also appears when divorce is measured differently. The National Center for Family & Marriage Research found that 76% of Southern states ranked in the upper half nationally for the refined divorce rate in 2024, which measures divorces among married women rather than the overall population.
One piece of the puzzle may be when people marry. Southern states tend to have younger ages at first marriage than states in other parts of the country, and U.S. research has linked younger marriage with greater marital instability. However, age at marriage is only one factor, and this relationship does not mean marrying younger by itself causes divorce.
Learn More on the Voronoi App
To explore how divorce rates can also differ by occupation, see Ranked: Jobs With the Highest and Lowest Divorce Rates on the Voronoi app.
Source: https://www.visualcapitalist.com/marriage-vs-divorce-rates-by-u-s-state/
Related articles