How Much Americans Spend Each Year, by Generation
Gen X households spend over $100,000 a year, but Millennials lead in housing costs. See how spending compares across five generations.
A Look at How Americans Spend Across Generations
Key Takeaways
Gen X is the only generation averaging more than $100,000 in annual household spending.
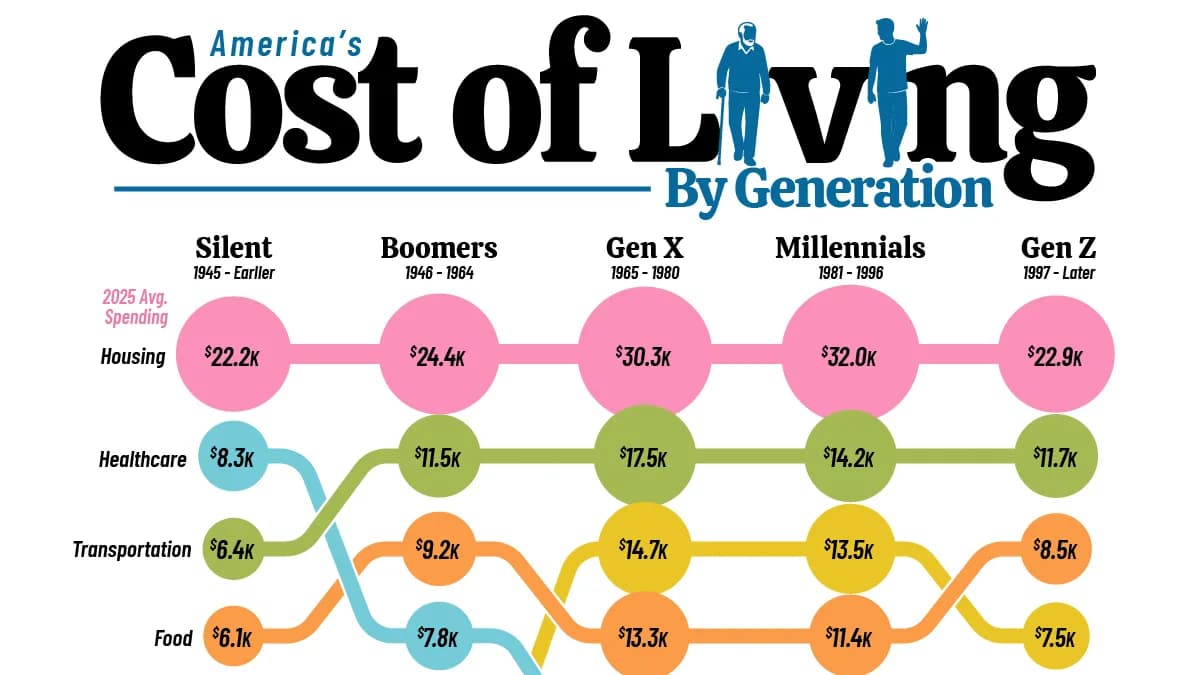
Millennials spend the most on housing, averaging nearly $32,000 a year.
Healthcare spending rises from $2,766 for Gen Z to $8,305 for the Silent Generation.
American household spending changes considerably across generations, reflecting differences in household size, housing costs, transportation needs, and healthcare expenses.
This graphic compares average annual household expenditures across five generations in 2025, based on the U.S. Bureau of Labor Statistics Consumer Expenditure Survey. Households are grouped by the generation of the person listed first as owning or renting the home.
Which Generation Spends the Most?
Gen X households spend $100,602 per year on average, making them the only generation to cross the $100,000 mark. Millennials rank second at $89,354, followed by Boomers at $70,795.
CategoryAverage Annual U.S. Household Spending (2025)
Gen ZMillennialsGen XBoomersSilent
Housing$22.9K$32.0K$30.3K$24.4K$22.2K
Transportation$11.7K$14.2K$17.5K$11.5K$6.4K
Food$8.5K$11.4K$13.3K$9.2K$6.1K
Healthcare$2.8K$5.4K$6.9K$7.8K$8.3K
Insurance & pensions$7.5K$13.5K$14.7K$6.0K$1.3K
Entertainment$2.2K$4.2K$5.7K$3.5K$2.0K
Apparel$1.2K$2.1K$2.7K$1.7K$871
Personal care$669$1.1K$1.2K$862$666
Alcohol$423$689$744$606$293
Tobacco $263$376$492$322$153
Total spending$61.7K$89.4K$100.6K$70.8K$54.2K
Selected categories are shown and do not sum to the total.
At roughly $8,400 per month, Gen X households spend about $3,300 more per month than Gen Z households and $3,900 more than those in the Silent Generation.
Much of that gap reflects life stage. Gen X households average 2.8 people and 2.3 vehicles, compared with 2.2 people and 1.4 vehicles for Gen Z. Their transportation spending reaches $17,493 annually, including $6,662 on vehicle purchases.
Millennials, meanwhile, have the largest households of any generation, averaging 3.1 people. They also lead all generations in housing spending, at $31,981 per year, or about $2,665 per month.
How Spending Changes as Americans Age
The composition of spending changes almost as much as the total. Housing accounts for 37% of Gen Z expenditures, while transportation, food, and retirement contributions become larger expenses during Americans’ prime working and family-building years.
Healthcare follows a different pattern, accounting for a growing share of household budgets among older generations. Boomers spend $7,783 annually on healthcare, while Silent Generation households spend $8,305, or more than 15% of their total expenditures.
Homeownership rates also vary considerably across generations. Just 23% of Gen Z households own their homes, compared with 52% of Millennials, 73% of Gen X, and 79% of Boomers. Among Silent Generation households, 61% own their homes without a mortgage.
These differences highlight why household spending is not necessarily a measure of financial comfort. Larger families, vehicle ownership, housing costs, and healthcare needs all shape how much each generation spends. The figures offer a snapshot of American household budgets at different life stages rather than a direct comparison of individual living costs.
Learn More on the Voronoi App
To learn more about household finances, see this graphic showing the cost of the American Dream over a lifetime.
Get the latest news delivered to your inbox.
Related articles