Ranked: Government Debt by Country in 2026
The U.S. and China hold 53% of global government debt. See how 190 countries compare and which owe more than their annual economic output.
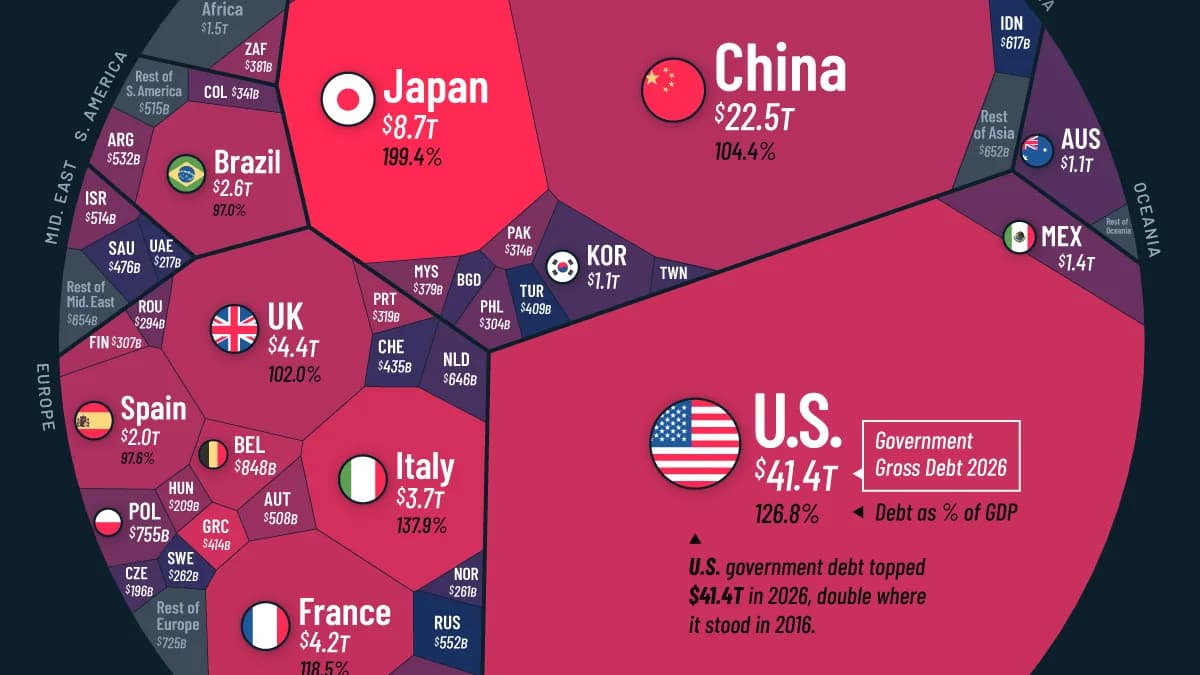
How Government Debt Compares Around the World in 2026
Key Takeaways
Global government gross debt is projected to reach $121 trillion in 2026, equivalent to 94.6% of world GDP.
The U.S. and China account for nearly 53% of the total, with a combined $63.9 trillion in debt.
U.S. government debt has risen from roughly 108% to 127% of GDP over the past decade, while China’s debt is projected to surpass 100% of GDP in 2026.
Government borrowing has climbed to historic levels, with rising interest costs and mounting spending pressures putting public finances under strain. While the world’s largest economies account for much of the total, debt burdens relative to economic output tell a different story.
This graphic breaks down projected government debt by country in 2026, based on the International Monetary Fund’s October 2026 World Economic Outlook. Figures represent general government gross debt, including liabilities across different levels of government.
Government Debt by Country in 2026
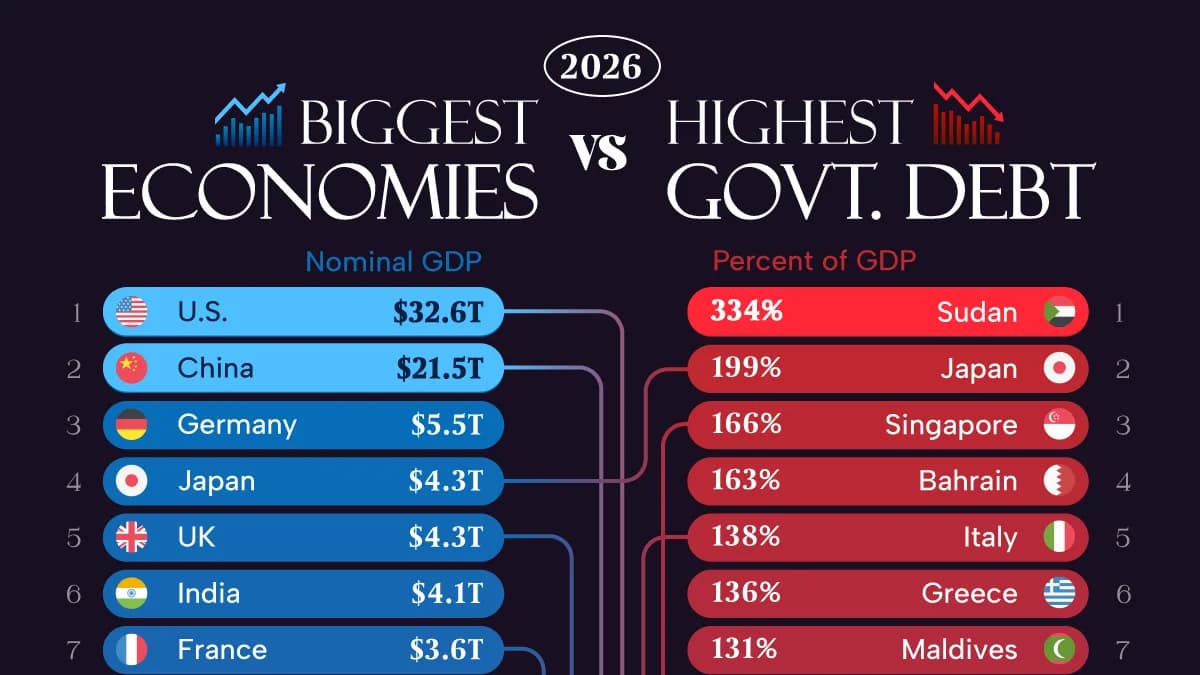
The table below ranks countries by their projected government debt in U.S. dollars, with debt-to-GDP ratios providing a measure of each country’s debt burden relative to its economy.
RankCountryValue of Debt (Billions $)Debt-to-GDP (2026)
1 U.S.41,391126.8%
2 China22,494104.4%
3 Japan8,658199.4%
4 UK4,354102.0%
5 France4,212118.5%
6 Italy3,726137.9%
7 Germany3,53464.6%
8 India3,37483.1%
9 Canada2,879115.6%
10 Brazil2,57597.0%
11 Spain2,03597.6%
12 Mexico1,35162.1%
13 Singapore1,111166.4%
14 Australia1,11052.6%
15 South Korea1,06247.3%
16 Belgium848109.8%
17 Poland75566.6%
18 Netherlands64645.4%
19 Indonesia61741.7%
20 Russia55219.3%
21 Argentina53269.3%
22 Israel51468.8%
23 Austria50882.4%
24 Saudi Arabia47635.4%
25 Switzerland43538.3%
26 Greece414136.0%
27 Türkiye40922.5%
28 Thailand40367.2%
29 South Africa38178.0%
30 Malaysia37969.2%
31 Egypt37284.0%
32 Colombia34159.5%
33 Portugal31985.1%
34 Pakistan31469.8%
35 Finland30790.6%
36 Philippines30460.5%
37 Romania29462.6%
38 Sweden26235.1%
39 Norway26140.0%
40 Ukraine256111.8%
41 Ireland23833.5%
42 UAE21732.8%
43 Taiwan21521.1%
44 Hungary20978.7%
45 Bangladesh20540.5%
46 Czechia19645.8%
47 Iraq17471.1%
48 Chile17242.8%
49 Algeria17251.8%
50 New Zealand15657.1%
51 Vietnam15328.3%
52 Nigeria13434.6%
53 Denmark13226.4%
54 Morocco13066.6%
55 Iran12239.1%
56 Peru11428.6%
57 Kenya11072.9%
58 Sri Lanka10595.2%
59 Slovakia10462.2%
60 Sudan103334.4%
61 Kazakhstan9523.8%
62 Qatar9446.4%
63 Dominican Republic8357.2%
64 Angola8151.5%
65 Bahrain75162.8%
66 Libya71125.2%
67 Costa Rica7161.8%
68 Ecuador7154.5%
69 Ghana6751.7%
70 Croatia6556.3%
71 Uruguay6467.7%
72 Hong Kong SAR6414.1%
73 Côte d'Ivoire6457.8%
74 Slovenia5663.5%
75 Panama5456.4%
76 Tunisia5486.1%
77 Bolivia54100.2%
78 Jordan5482.5%
79 Ethiopia5240.7%
80 Uzbekistan4927.6%
81 Bulgaria4832.9%
82 Lebanon48139.4%
83 Serbia4842.9%
84 Lithuania4744.7%
85 Tanzania4648.1%
86 Myanmar4453.3%
87 Uganda4055.1%
88 Kuwait3926.6%
89 Oman3831.1%
90 Guatemala3627.5%
91 Zambia3582.1%
92 Belarus3431.1%
93 El Salvador3385.0%
94 Luxembourg3128.5%
95 DR Congo2923.7%
96 Cameroon2640.1%
97 Latvia2547.0%
98 Puerto Rico2418.2%
99 Paraguay2336.6%
100 Iceland2354.6%
101 Cyprus2351.4%
102 Trinidad and Tobago2384.6%
103 Mozambique2391.0%
104 Nepal2349.4%
105 Zimbabwe2233.5%
106 Gabon2283.7%
107 Honduras1844.0%
108 Papua New Guinea1746.8%
109 Burkina Faso1751.0%
110 Albania1649.7%
111 Benin1658.1%
112 Armenia1648.1%
113 Guinea1634.8%
114 Republic of the Congo1580.5%
115 Jamaica1564.3%
116 Mauritius1587.6%
117 Azerbaijan1516.5%
118 Laos1579.8%
119 Georgia1533.1%
120 Malawi1478.0%
121 Malta1446.4%
122 Estonia1427.5%
123 Mali1439.7%
124 Mongolia1444.1%
125 Cambodia1425.1%
126 Bahamas1370.2%
127 Namibia1267.5%
128 Rwanda1263.4%
129 Bosnia and Herzegovina1231.4%
130 North Macedonia1153.8%
131 Niger1146.3%
132 Maldives11130.7%
133 Madagascar1049.8%
134 Guyana1025.3%
135 West Bank and Gaza1055.9%
136 Moldova941.8%
137 Kyrgyz Republic934.0%
138 Botswana940.3%
139 Togo964.7%
140 Nicaragua831.7%
141 Chad831.1%
142 Barbados893.8%
143 Montenegro766.8%
144 Mauritania538.3%
145 Fiji578.9%
146 Suriname585.1%
147 Equatorial Guinea532.9%
148 Bhutan5116.2%
149 Sierra Leone450.1%
150 Haiti410.5%
151 Tajikistan418.3%
152 Cabo Verde4109.9%
153 South Sudan343.2%
154 Eswatini352.5%
155 Liberia354.0%
156 Burundi340.4%
157 Aruba359.6%
158 Kosovo318.1%
159 Turkmenistan22.9%
160 Belize264.6%
161 Central African Republic243.5%
162 Guinea-Bissau273.9%
163 Saint Lucia278.1%
164 Gambia267.4%
165 Antigua and Barbuda266.8%
166 Lesotho147.5%
167 Saint Vincent and the Grenadines1111.6%
168 Djibouti128.7%
169 San Marino156.8%
170 Andorra127.8%
171 Seychelles152.7%
172 Grenada166.8%
173 Dominica199.7%
174 Saint Kitts and Nevis165.1%
175 São Tomé and Príncipe155.9%
176 Comoros134.7%
177 Solomon Islands132.1%
178 Vanuatu136.6%
179 Timor-Leste0.313.9%
180 Samoa0.318.6%
181 Brunei Darussalam0.21.3%
182 Palau0.253.8%
183 Tonga0.224.0%
184 Liechtenstein0.050.5%
185 Marshall Islands0.0513.9%
186 Micronesia0.047.7%
187 Kiribati0.037.7%
188 Naoero0.012.6%
189 Tuvalu0.002.5%
190 Macao SAR0.000.0%
U.S. and China Hold Over Half of Global Government Debt
The U.S. leads with $41.4 trillion in government debt, representing roughly one-third of the worldwide total.
Over the past decade, the U.S. debt burden has climbed from 107.5% of GDP in 2016 to 126.8% in 2026, as government borrowing has outpaced economic growth. The cost of servicing that debt is also mounting. In fiscal 2026, federal net interest payments reached $1.1 trillion, exceeding military spending by $225 billion.
China ranks second at $22.5 trillion, with government debt projected to surpass 100% of GDP for the first time.
Unlike the U.S., a central source of China’s fiscal pressure is its local government financing system. For years, local authorities relied on borrowing and land-sale revenues to fund infrastructure and development. The property downturn has weakened this revenue model, increasing pressure on public finances.
Despite their different fiscal challenges, both countries illustrate how rising government borrowing is reshaping public finances in the world’s two largest economies.
Which Countries Owe More Than Their Economies Produce?
The countries with the largest debt totals are not necessarily those carrying the heaviest debt burdens. Measured against economic output, government debt is projected to exceed 100% of GDP in 20 economies in 2026, ranging from major industrialized nations to smaller developing economies.
Sudan has the world’s highest debt-to-GDP ratio at 334.4%, followed by Japan at 199.4%. France (118.5%) and Canada (115.6%) also have debt exceeding their annual economic output, while Bolivia sits just above the threshold at 100.2%.
But even countries below this threshold can face considerable financial pressure. Interest costs exceed public spending on health care or education in 51 developing countries, which together are home to 3.7 billion people.
Looking ahead, the IMF projects that global government debt will surpass 100% of GDP by 2030, reaching a level last seen shortly after World War II.
Learn More on the Voronoi App
To learn more about this topic, check out this graphic ranking countries by government debt per person.
Get the latest news delivered to your inbox.
Related articles