Mapped: The U.S. States With the Most School Funding
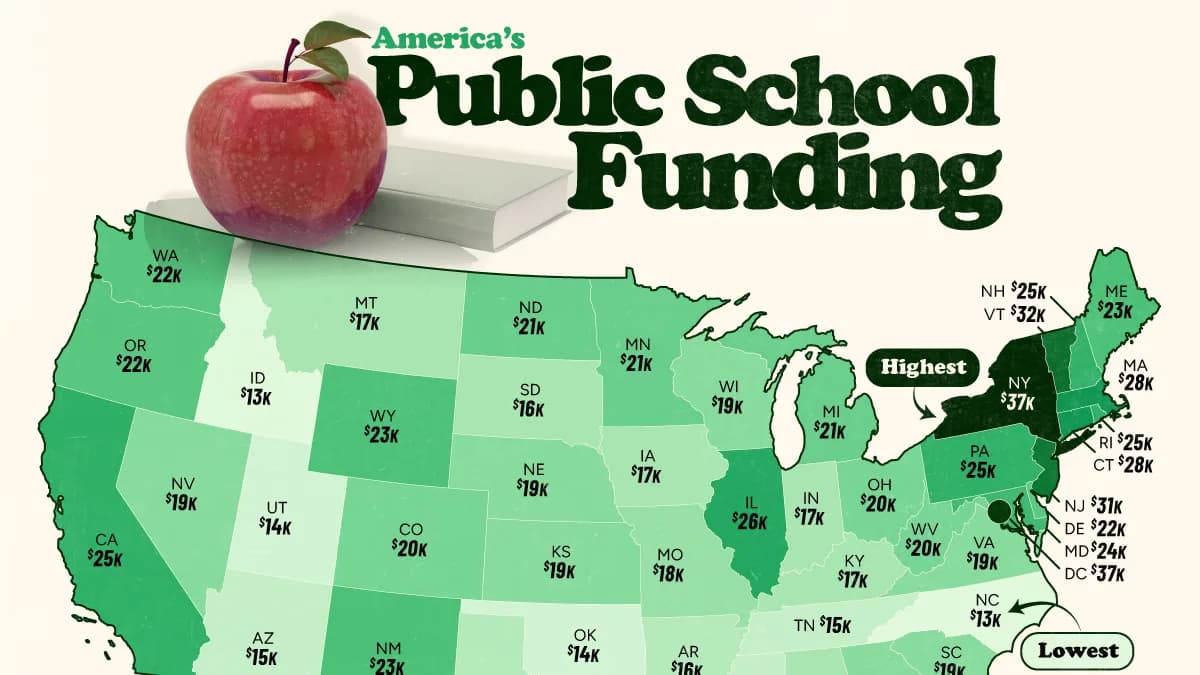
Across the country, around $21,000 is spent on the average public-school student. New York and D.C. nearly double this figure.
How Public School Funding Compares Across U.S. States
Key Takeaways
New York ($37,469) and Washington, D.C. ($36,698) lead the U.S. in public school funding per student.
State and local sources supply nearly 90% of public school funding nationwide.
Property wealth, state funding policies, and labor costs help explain differences between school systems.
Public schools across the United States receive an average of $21,065 in funding per student, but the amount varies considerably depending on where students live.
This map compares public school funding per student across all 50 states and Washington, D.C., using 2023–24 figures from the National Center for Education Statistics (NCES). The figures measure revenue received from local, state, and federal sources rather than spending exclusively on classroom instruction.
The Northeast Leads in School Funding
The Northeast leads the nation in public school funding per student. New York tops the rankings at $37,469, followed by Washington, D.C. ($36,698), Vermont ($32,346), and New Jersey ($30,916).
Connecticut and Massachusetts also rank among the top six, highlighting the region’s concentration of well-funded public school systems.
At the other end, North Carolina received $13,227 per student, narrowly below Idaho ($13,319). This means New York received nearly three times as much funding per student as North Carolina.
The table below ranks U.S. states and Washington, D.C., by public school funding per student in 2024.
RankState or DistrictPublic-school funding
per student, $ (2024)
1New York37,469
2D.C.36,698
3Vermont32,346
4New Jersey30,916
5Connecticut28,075
6Massachusetts27,933
7Hawaii26,135
8Illinois26,107
9New Hampshire25,270
10California25,265
11Pennsylvania25,025
12Rhode Island24,706
13Maryland23,944
14New Mexico23,280
15Wyoming23,008
16Maine22,556
17Delaware22,207
18Oregon22,098
19Washington21,944
20Alaska21,927
21Michigan21,318
22Minnesota21,146
23North Dakota20,776
24Ohio19,930
25Colorado19,695
26West Virginia19,583
27Virginia19,333
28Wisconsin19,259
29South Carolina19,163
30Louisiana18,884
31Nevada18,619
32Nebraska18,541
33Kansas18,500
34Georgia18,497
35Missouri17,774
36Alabama17,408
37Iowa17,353
38Indiana17,113
39Kentucky16,976
40Montana16,813
41Florida16,653
42South Dakota16,476
43Texas16,159
44Arkansas15,555
45Tennessee15,440
46Mississippi15,256
47Arizona15,211
48Oklahoma14,244
49Utah14,095
50Idaho13,319
51North Carolina13,227
-- U.S. average21,065
Funding differences are also substantial among the nation’s most populous states. California received $25,265 per student, roughly $9,100 more than Texas and $8,600 more than Florida.
Higher funding does not necessarily translate into proportionately greater resources, however. Regional differences in wages and purchasing power affect how far education dollars go. Several Northeastern states also rank among the best-performing states in education, although funding alone does not explain those outcomes.
The Importance of Property Tax
School funding depends heavily on decisions made close to home. State and local sources supplied over 88% of public school revenue nationwide in 2023–24, with federal funding providing the remainder.
Local funding relies substantially on property taxes. Districts with more valuable homes and commercial property can raise more money at the same tax rate than districts with smaller tax bases. State aid formulas often aim to narrow this gap by directing more support toward districts with less capacity to raise revenue.
States also make choices about which students need additional resources. California, for example, provides supplemental funding for English learners, students from low-income families, and foster youth, with additional funding where those students represent a large share of enrollment. As a result, statewide averages can conceal substantial differences between districts.
What School Funding Actually Pays For
Education is labor-intensive. Salaries and employee benefits accounted for 77% of day-to-day public school spending in 2023–24. These expenses support teachers, classroom aides, counselors, bus drivers, maintenance staff, and other school employees.
The cost of providing these services varies by location. Schools operate in different labor markets, and regional wage differences affect how much funding is needed to hire staff. A larger budget in a high-cost area does not necessarily translate into a proportionately larger workforce.
Student needs and geography also influence costs. Special education, language support, and transportation can require additional resources, while small or isolated districts have fewer students over whom to spread fixed expenses. Understanding whether funding is sufficient therefore requires considering the services schools must provide, alongside the dollars they receive.
Learn More on the Voronoi App
To learn more about Americans’ views on federal education policy, check out 2/3 of Americans Say Hands Off the Department of Education on Voronoi.
Source: https://www.visualcapitalist.com/mapped-the-u-s-states-with-the-most-school-funding/
Get the latest news delivered to your inbox.
Related articles