Mapped: Median Household Income by U.S. State
Americans are earning more than ever, but six-figure incomes are typical in just eight states. What separates the top from the bottom?
How Household Incomes Compare Across America
Key Takeaways
The median U.S. household income reached $84,780 in 2025, rising 1.2% after inflation.
Eight states had median household incomes above $100,000, led by New Jersey, Maryland, and New Hampshire.
Higher household incomes don’t necessarily mean greater purchasing power, especially in states with elevated living costs.
The gap between America’s highest- and lowest-income states approached $50,000 in 2025, highlighting the wide range of household earnings across the country.
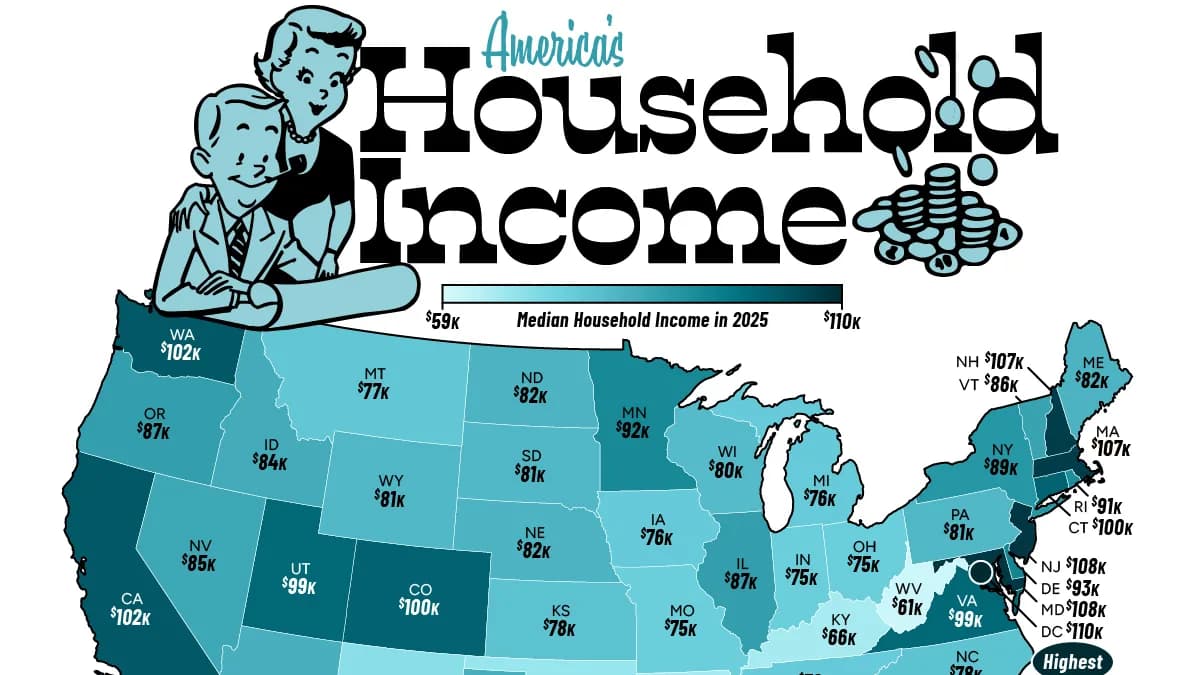
This map uses 2025 data from the U.S. Census Bureau’s American Community Survey to compare median household incomes before taxes, expressed in inflation-adjusted dollars.
Median Household Income by State in 2025
Mississippi had the lowest median household income at $59,346, while New Jersey led the 50 states at $107,797. Washington, D.C., ranked even higher at $109,505.
Many of the highest-income states are concentrated along the coasts, where technology, finance, and professional services support higher earnings. However, Mountain West states such as Colorado and Utah also rank near the top.
RankStateMedian Household Income (2025)Real Change (2024-2025)
1Washington, DC$109,505-2.8%
2New Jersey$107,7970.6%
3Maryland$107,7001.9%
4New Hampshire$106,7594.2%
5Massachusetts$106,539-1.0%
6Hawaii$105,0131.5%
7California$102,159-0.7%
8Washington$101,946-0.1%
9Connecticut$100,0561.4%
10Colorado$99,7290.0%
11Virginia$99,3225.0%
12Utah$99,3110.0%
13Alaska$95,220-3.1%
14Delaware$92,5202.9%
15Minnesota$92,2973.2%
16Rhode Island$91,0396.2%
17New York$89,2101.2%
18Oregon$86,953-0.7%
19Illinois$86,6761.4%
20Vermont$86,0181.2%
21Nevada$85,1982.2%
22Idaho$84,2341.0%
23Arizona$82,940-0.9%
24Texas$82,6250.9%
25Georgia$81,847-0.4%
26Maine$81,7604.1%
27Nebraska$81,6144.0%
28North Dakota$81,5452.0%
29Pennsylvania$81,4732.3%
30Wyoming$80,8944.3%
31Florida$80,8461.3%
32South Dakota$80,5062.0%
33Wisconsin$80,2130.8%
34Kansas$77,8240.3%
35North Carolina$77,6382.2%
36Montana$77,099-0.4%
37Iowa$76,483-1.4%
38Tennessee$75,8752.6%
39Michigan$75,8322.0%
40Missouri$75,4852.7%
41Ohio$74,8040.9%
42Indiana$74,5160.8%
43South Carolina$73,672-0.9%
44New Mexico$70,3421.0%
45Oklahoma$68,4410.7%
46Alabama$67,663-1.2%
47Kentucky$66,4470.3%
48Arkansas$65,5882.8%
49Louisiana$65,1394.0%
50West Virginia$61,340-1.8%
51Mississippi$59,346-2.3%
-- U.S. Overall$84,7801.2%
A higher household income doesn’t always translate into greater purchasing power, particularly when local living costs are taken into account.
In Montana, the median household income of $77,099 falls nearly $99,000 short of the income needed to afford a typical home. In Iowa, where incomes are moderately lower, the affordability gap is just $2,287.
Beyond housing, the cost of living is more than 40% above the national average in Hawaii, Massachusetts, and California, three of the country’s highest-income states.
These differences highlight why income rankings alone don’t tell the full story of what households can afford.
Where Household Incomes Are Rising Fastest
While household incomes rose nationally in 2025, growth varied considerably across the country.
Real median incomes increased in 35 states, declined in 13 states and Washington, D.C., and remained unchanged in two. Rhode Island led with a 6.2% increase, followed by Virginia at 5.0% and Wyoming at 4.3%.
At the other end, Alaska (-3.1%), Washington, D.C. (-2.8%), and Mississippi (-2.3%) recorded the largest estimated declines. California’s median income also fell 0.7% after inflation, despite remaining above the six-figure threshold.
Virginia stands out as an example of both high household income and strong growth, with its median reaching $99,322.
Overall, the figures show that income growth doesn’t always follow existing income rankings. Some lower-income states are gaining ground, while several of the nation’s highest-income states saw incomes stagnate or decline after inflation.
Learn More on the Voronoi App
To explore longer-term trends, check out this graphic showing which states have experienced the largest and smallest increases in median household income over the past 25 years.
Source: https://www.visualcapitalist.com/mapped-median-household-income-by-us-state/
Get the latest news delivered to your inbox.
Related articles