Ranked: Europe’s Richest Countries by GDP per Capita (2026)
Europe's largest economy may be Germany, but its richest country by GDP per capita is a small Alpine microstate with only 40,000 citizens.
Which European Countries Are the Richest in 2026?
Key Takeaways
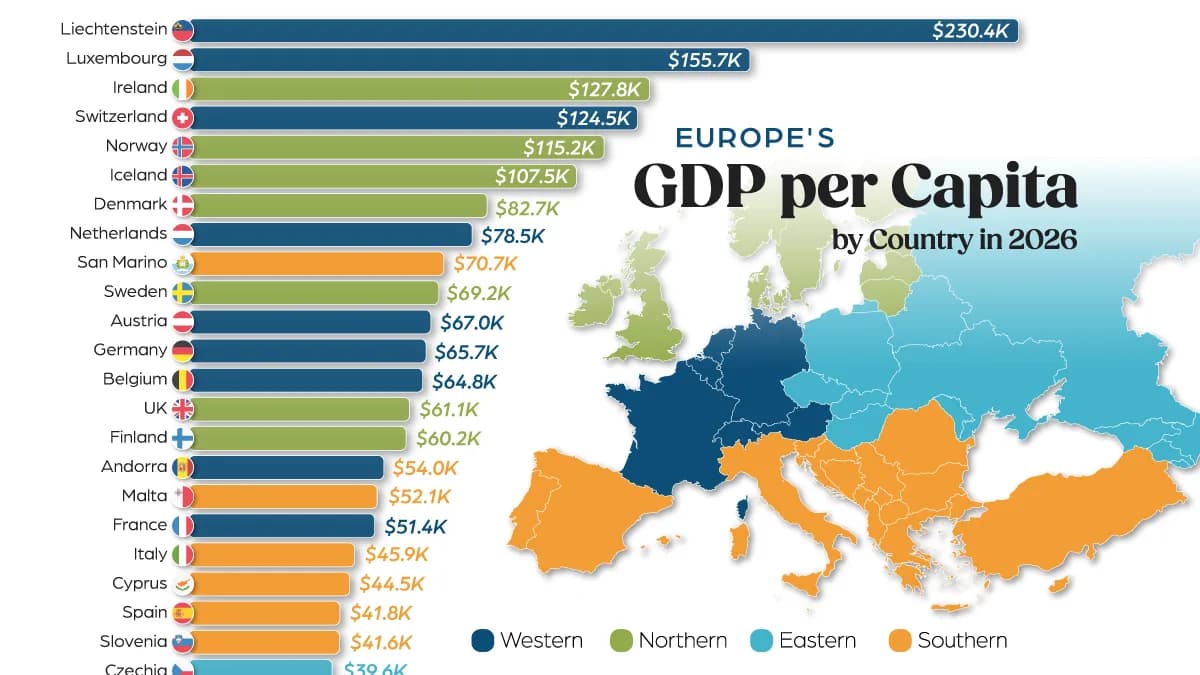
Liechtenstein leads Europe in GDP per capita at $230,417, followed by Luxembourg at $155,733.
Just six European countries have GDP per capita above $100,000, all located in Northern or Western Europe.
Ukraine ranks last in Europe at $7,075 per person, reflecting the economic impact of Russia’s full-scale invasion.
Europe’s largest economies aren’t necessarily its richest on a per-person basis. Several of the continent’s smallest countries outperform economic powerhouses like Germany, France, and the UK.
This visualization ranks European countries by nominal gross domestic product (GDP) per capita using 2026 projections from the International Monetary Fund (IMF) World Economic Outlook’s October 2026 update. Figures are expressed in current U.S. dollars at market exchange rates.
Nominal GDP per capita divides economic output by population, but does not measure the average person’s salary or wealth.
Europe’s Economic Hubs
The six European countries with GDP per capita above $100,000 are Liechtenstein, Luxembourg, Ireland, Switzerland, Norway, and Iceland.
Germany, Europe’s largest economy by total GDP, ranks 12th at $65,699 per person. Despite its enormous economic output, its much larger population puts it well below Europe’s smaller, high-income economies on a per-person basis.
The table below ranks Europe’s economies by projected GDP per capita in 2026.
RankCountryGDP per Capita (2026)
1 Liechtenstein$230,417
2 Luxembourg$155,733
3 Ireland$127,837
4 Switzerland$124,478
5 Norway$115,188
6 Iceland$107,464
7 Denmark$82,714
8 Netherlands$78,535
9 San Marino$70,662
10 Sweden$69,244
11 Austria$67,020
12 Germany$65,699
13 Belgium$64,774
14 UK$61,108
15 Finland$60,156
16 Andorra$53,988
17 Malta$52,149
18 France$51,448
19 Italy$45,886
20 Cyprus$44,477
21 Spain$41,756
22 Slovenia$41,631
23 Czechia$39,614
24 Estonia$37,310
25 Lithuania$36,135
26 Portugal$34,815
27 Poland$31,186
28 Slovakia$30,884
29 Croatia$29,860
30 Greece$29,413
31 Latvia$28,630
32 Hungary$27,884
33 Romania$24,741
34 Bulgaria$23,000
35 Türkiye$21,079
36 Russia$19,953
37 Serbia$17,126
38 Montenegro$16,211
39 Albania$13,968
40 Belarus$11,963
41 North Macedonia$11,762
42 Georgia$11,234
43 Bosnia and Herzegovina$10,845
44 Armenia$10,662
45 Moldova$9,497
46 Kosovo$8,902
47 Azerbaijan$8,497
48 Ukraine$7,075
At the opposite end of the ranking is Ukraine, where GDP per capita stands at just $7,075. The country experienced a major economic contraction following Russia’s full-scale invasion in 2022, and economic output has yet to fully recover.
Why Europe’s Smallest Countries Rank So High
Liechtenstein and Luxembourg benefit partly from how cross-border employment affects GDP per capita. Commuters contribute to economic output where they work but are counted in the population where they live. This can produce unusually high GDP-per-capita figures, particularly in small economies.
The effect is substantial: nearly half of Luxembourg’s workers in 2025 lived in neighboring countries such as Belgium, France, and Germany. In Liechtenstein, internationally competitive manufacturers and financial services generate output supported partly by commuters from Austria and Switzerland.
Meanwhile, Ireland’s GDP per capita ($127,837) is influenced by substantial multinational activity, including intellectual property and aircraft leasing. An alternative measure designed to remove major globalization-related distortions, modified gross national income, amounted to just 55.4% of GDP in 2025. This gap helps explain why Ireland’s headline ranking may not reflect typical household finances.
How Cost of Living Changes the Comparison
A dollar-equivalent amount buys different quantities of goods and services across Europe. Adjusting for purchasing power parity (PPP) accounts for these price differences, providing another perspective on the gaps between economies.
Poland ($31,186) illustrates the difference. At market exchange rates, its projected GDP per capita is roughly 25% below Spain’s ($41,756). After adjusting for purchasing power, however, the two economies are much closer because goods and services are generally cheaper in Poland.
Exchange rates can also change a country’s dollar-denominated GDP per capita without an equivalent change in the volume of goods and services it produces. For readers comparing living standards, local prices and household income therefore provide essential context beyond the headline GDP ranking.
Learn More on the Voronoi App
To explore regional differences within Europe’s largest economy, check out GDP per Capita in Germany on Voronoi.
Get the latest news delivered to your inbox.
Related articles