
Mapped: How U.S.-China Trade Changed by U.S. State
Trade with China fell in 49 of 50 U.S. states in 2025. Only New Mexico grew, lifted by a surge in electronics exports.
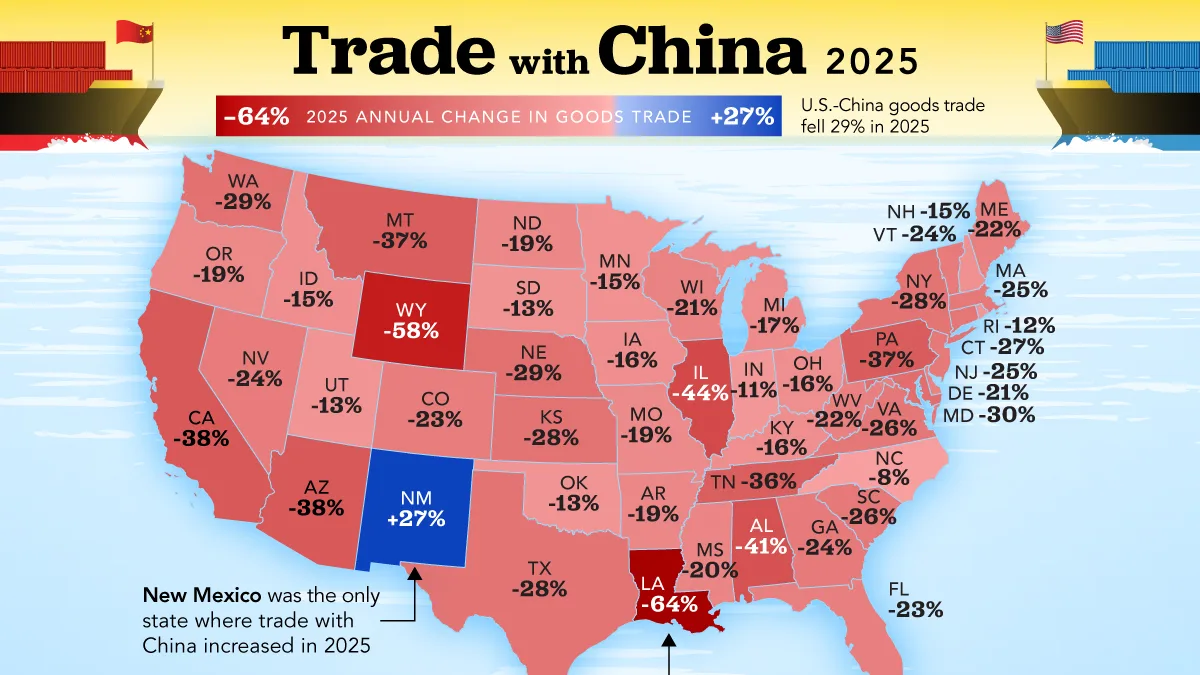
How U.S.-China Trade Shifted Across the States
Key Takeaways
New Mexico was the only state whose trade with China grew in 2025, rising 27% on a surge in electronics exports that include computer chips.
Every other state traded less with China, led by Louisiana (down 64%) and Wyoming (down 58%).
California lost the most in dollar terms, $52.2 billion, as its imports from China fell by 38%.
U.S. goods trade with China fell 29% in 2025, from $583.6 billion to $414.6 billion, amid a year of sharply higher tariffs and shifting trade flows.
This map shows the change in each state’s goods trade with China from 2024 to 2025, using data from the U.S. Census Bureau.
Trade is the sum of a state’s exports to and imports from mainland China, in current U.S. dollars. Exports are credited to the state where a shipment begins its journey to the port, which is not always where the goods were produced.
Trade With China Fell in 49 of 50 States
The size of the decline varied widely, from 7.6% in North Carolina to 64.3% in Louisiana. Overall, 22 states lost at least a quarter of their goods trade value with China.
The table below ranks all 50 states by the percentage change in their goods trade with China from 2024 to 2025, along with each year’s trade value:
State2024
(Goods traded, $B)2025
(Goods traded, $B)Change (%)
New Mexico3.94.927.2
North Carolina13.012.0-7.6
Indiana14.312.7-11.2
Rhode Island0.70.6-12.1
Utah3.83.3-13.0
Oklahoma2.82.5-13.0
South Dakota0.40.3-13.3
New Hampshire0.90.8-14.7
Minnesota8.77.4-14.7
Idaho0.50.4-15.2
Kentucky11.09.3-15.6
Iowa2.21.9-15.9
Ohio13.211.1-16.1
Michigan11.09.1-17.1
Missouri4.94.0-18.5
Oregon8.56.9-19.0
Arkansas1.31.0-19.3
North Dakota0.20.2-19.4
Mississippi3.62.8-20.4
Delaware1.21.0-21.1
Wisconsin7.96.2-21.2
Maine0.30.2-22.0
West Virginia0.60.5-22.3
Florida14.311.0-22.7
Colorado2.62.0-23.4
Nevada5.84.4-23.6
Vermont0.30.2-23.9
Georgia21.015.9-24.2
New Jersey16.412.3-25.3
Massachusetts7.35.4-25.4
South Carolina12.69.4-25.5
Virginia7.15.2-26.3
Connecticut2.82.1-26.5
Texas58.742.5-27.6
New York21.615.6-27.6
Kansas2.31.7-28.0
Washington23.116.5-28.6
Nebraska1.41.0-29.0
Hawaii0.30.2-29.1
Maryland3.82.7-29.5
Tennessee24.415.6-36.1
Montana0.20.1-36.5
Pennsylvania20.012.6-36.8
California138.586.3-37.7
Arizona7.14.4-37.9
Alabama8.24.9-41.1
Illinois46.726.3-43.7
Alaska1.60.9-46.4
Wyoming0.30.1-57.5
Louisiana11.24.0-64.3
U.S. Total583.6414.6-29.0
Figures may not sum due to rounding.
Most of the lost dollars came from imports. Nationally, imports from China fell by $132 billion, compared with a $37 billion decline in exports, meaning nearly four-fifths of the decrease in trade value came from lower imports. California and Illinois alone accounted for about half of that import decline.
The steepest percentage drops tell a different story. In Louisiana, Wyoming, and Alaska, the three biggest decliners, trade fell mainly because exports to China dropped.
New Mexico was the lone exception, driven by a surge in electronics exports.
Why New Mexico Went the Other Way
New Mexico’s trade with China rose 27% to $4.9 billion, and a single category explains the gain: exports of electrical machinery and electronics, which include computer chips, climbed 69% to $3.0 billion.
That trade barely existed a few years ago. New Mexico shipped only about $20 million of these goods to China annually in 2022 and 2023, before exports jumped to $1.8 billion in 2024. That same year, Intel opened Fab 9, an advanced chip-packaging plant in Rio Rancho.
The growth also held up through the tariff war. China reportedly exempted some U.S.-made chips from its 125% tariff in April 2025, although it did not publicly confirm the move.
China accounted for 18% of New Mexico’s goods trade in 2025, making it the most China-reliant state.
Louisiana’s Soybean and Fuel Exports to China Collapsed
At the other end of the map, Louisiana lost $7.2 billion in trade with China, and almost all of it came from exports, which fell 71%. Soybean shipments dropped from $5.9 billion to $2.1 billion, while fuel exports fell from $3.2 billion to $0.3 billion.
Both were among the first targets of China’s retaliation. Beijing added tariffs on U.S. coal, LNG, and crude oil in February 2025 and on soybeans in March, before raising its tariff on all U.S. goods to 125% in April. The U.S. shipped virtually no soybeans to China from June through August, according to the American Farm Bureau Federation.
Much of that loss belongs to farmers upriver. Grain from across the Midwest moves down the Mississippi River to export terminals near New Orleans, and Census credits it to Louisiana, where the shipments are consolidated. Louisiana itself harvested 55 million bushels of soybeans in 2024, a fraction of the 474 million bushels it was credited with shipping to China.
As the Census Bureau notes, this methodology can overstate exports from port states and understate them from the states where the goods were produced, meaning the map may understate how hard the trade downturn hit parts of the Farm Belt.
Learn More on the Voronoi App
To learn more about how tariffs affected the U.S.-China trade relationship, check out this graphic on Voronoi.
Source: https://www.visualcapitalist.com/trade-change-with-china-by-state-2025/
Related articles
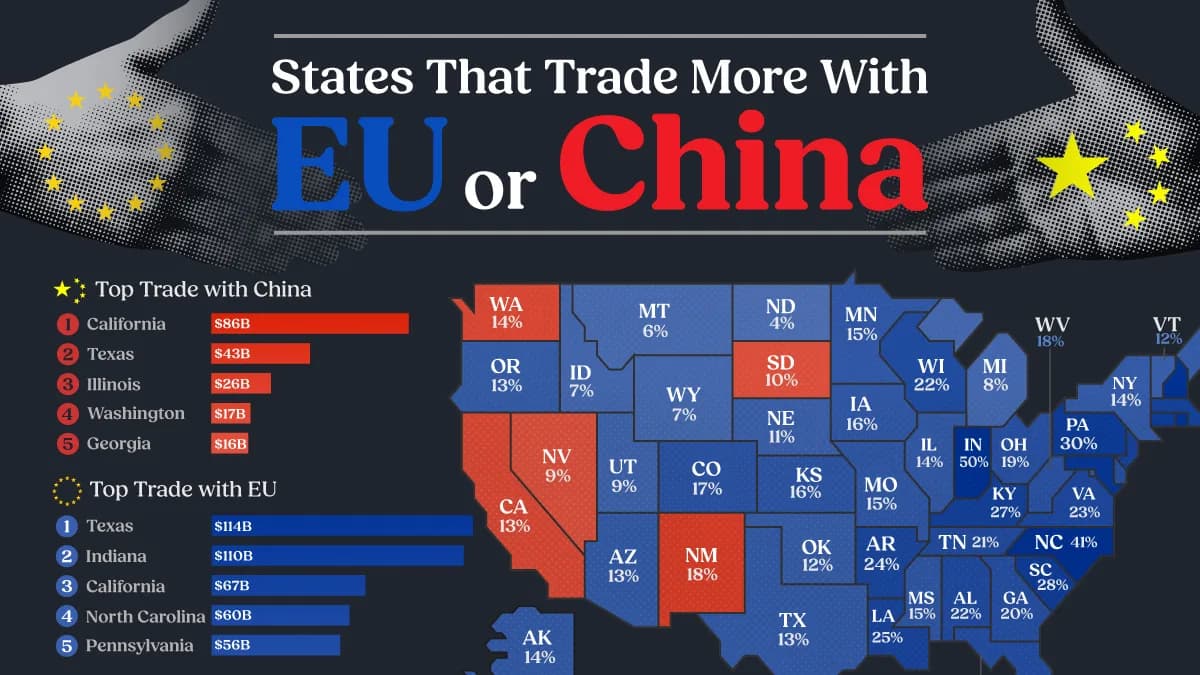
Mapped: Does Your State Trade More With China or the EU?
The European Union has emerged as an unexpected beneficiary of rising trade tensions between the U.S. and China.
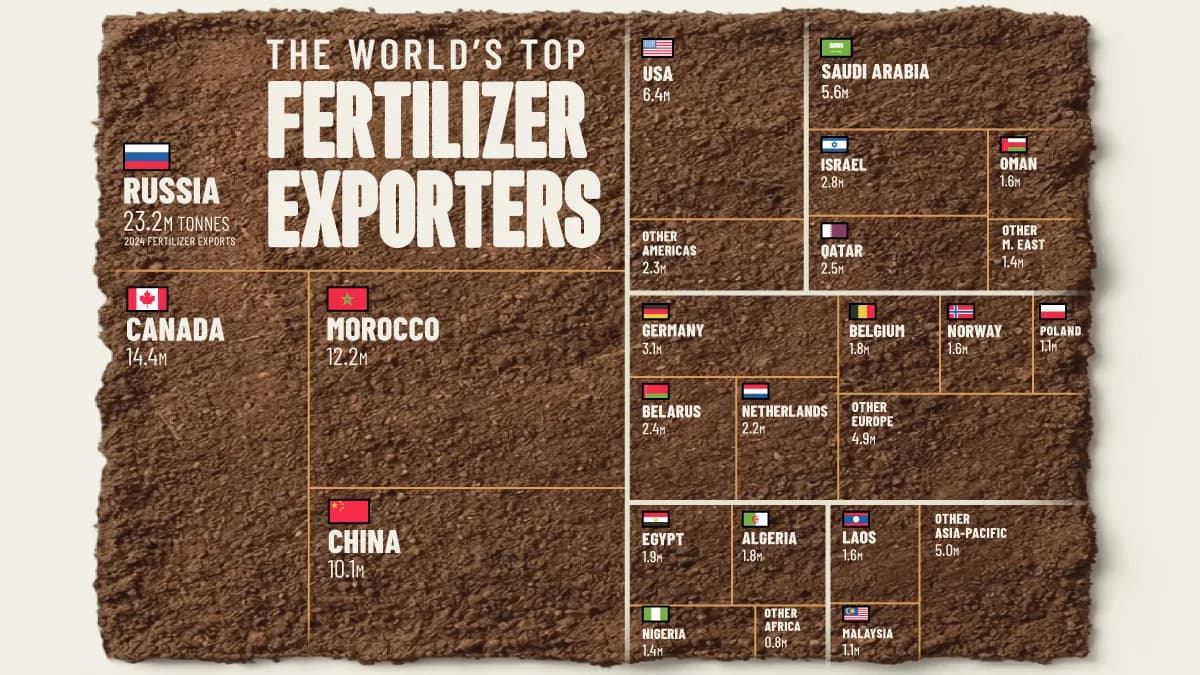
Ranked: The Countries That Dominate the Fertilizer Trade
Global agriculture depends on three main fertilizers. Four countries are responsible for over half of all fertilizer exports.
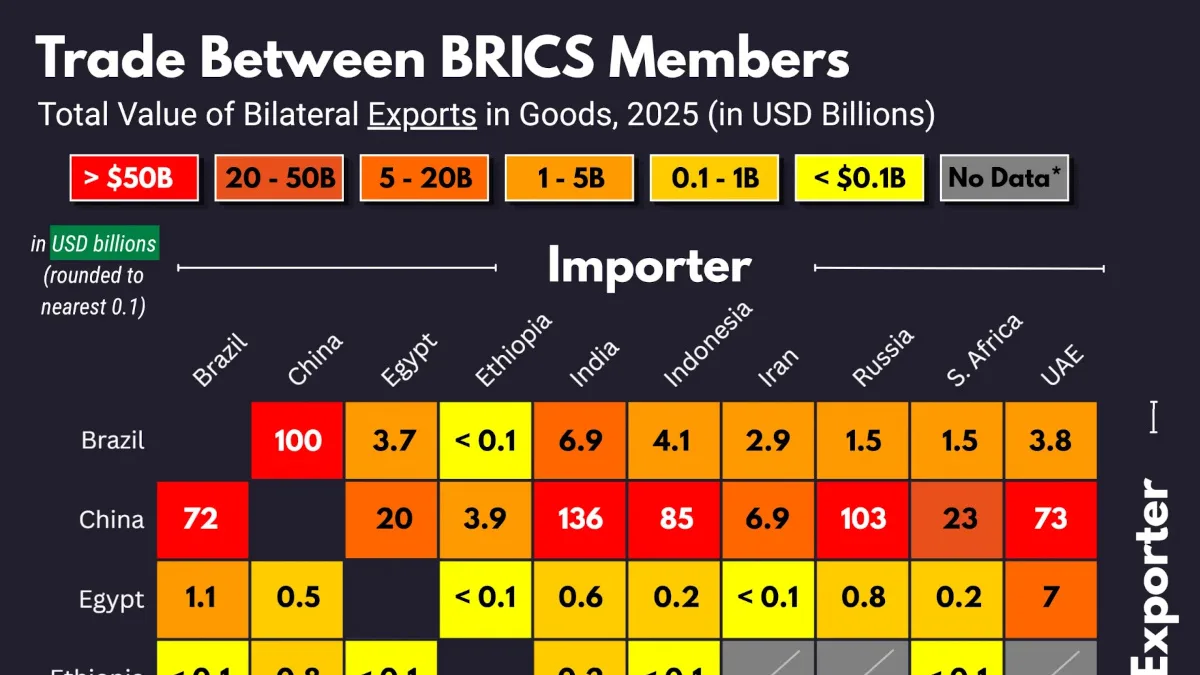
Which BRICS Countries Trade the Most With Each Other?
Which BRICS countries trade the most with each other? This chart maps bilateral exports across the 10-member group.