
The Global Stock Market Boom, by Country (2011–2025)
Global equities more than tripled in total market capitalization between 2011 and 2025. One country's stocks powered most of this growth.
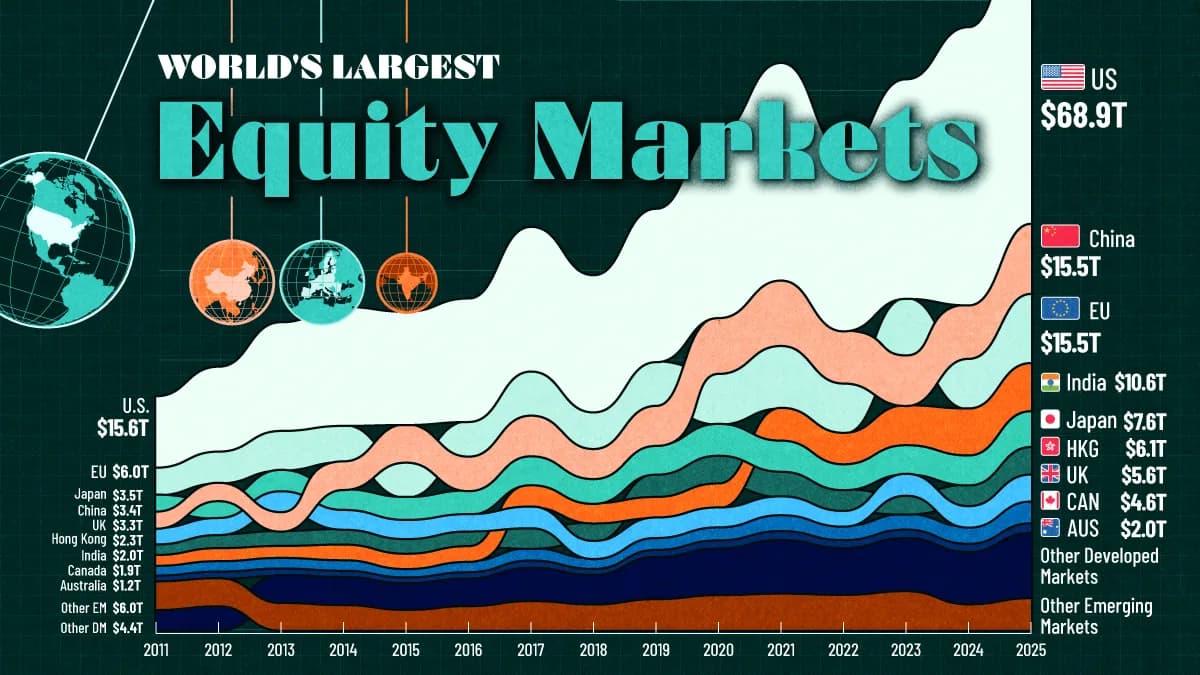
How the Global Stock Market Boom Unfolded
Key Takeaways
Global equity markets rose by more than $100 trillion in value between 2011 and 2025.
The U.S. led this growth, rising from $15.6 trillion in 2011 to $68.9 trillion in 2025.
China surpassed Japan in 2014 and, by 2025, matched the European Union at $15.5 trillion.
Over the past 15 years, the balance of global equity market value has shifted substantially as some markets expanded much faster than others.
This visualization tracks equity market capitalization from 2011 to 2025, using World Federation of Exchanges figures published in SIFMA’s Capital Markets Fact Book.
Market capitalization measures the value of outstanding shares at prevailing prices; all figures are expressed in nominal U.S. dollars and are not adjusted for inflation.
The Changing Leaderboard of Equity Markets
The U.S. has pulled comfortably ahead, expanding from $15.6 trillion in 2011 to $68.9 trillion of market capitalization in 2025. Its share of the global total grew from less than a third to roughly 44%.
Below the leader, the order shifted. China’s equity market surpassed Japan’s in 2014 amid a surge in stock buying, while India overtook Japan in 2021. By 2025, China and the European Union were level at approximately $15.5 trillion each.
The table below lists the world’s largest equity markets in both 2011 and 2025.
Equity MarketMarket capitalization ($T)
20112025
U.S.15.668.9
China3.415.5
European Union6.015.5
India2.010.6
Japan3.57.6
Hong Kong2.36.1
United Kingdom3.35.6
Canada1.94.6
Australia1.22.0
Other developed markets4.414.4
Other emerging markets6.06.9
Global total49.6157.8
The trend of a rising U.S. share of global equity markets reversed in 2025. While U.S. market capitalization continued to grow, its share of the global total fell from roughly 47% in 2024 to 44% in 2025 as markets elsewhere grew faster.
The U.S. nevertheless remains home to the New York Stock Exchange and Nasdaq, the world’s two largest stock exchanges.
How Tech Giants Expanded America’s Lead
The rise of large technology companies helps explain the U.S. market’s growing weight. Businesses built around software, digital advertising, and cloud computing can serve customers worldwide, allowing their revenue to expand far beyond the U.S. economy.
More recently, artificial intelligence has added another source of investor enthusiasm. Advances in AI and subsequent investor interest have boosted valuations for a subset of technology firms. Expectations of future profits can lift share prices well before those profits arrive, with substantial effects on the broader market.
Specifically, the so-called Magnificent Seven stocks have accounted for most of the S&P 500’s total return in both 2024 and 2025. This group consists of Alphabet, Amazon, Apple, Meta, Microsoft, NVIDIA, and Tesla.
The Gap Between Market Size and Economic Size
A stock market measures the value investors place on listed businesses rather than everything an economy produces. Private companies are absent, while listed multinationals can earn substantial revenue abroad.
China’s mid-2010s boom shows how financial conditions can reshape valuations. Heavy buying with borrowed money helped fuel the 2015 rally before prices reversed sharply that summer. Borrowing can amplify purchasing power on the way up and increase pressure to sell when prices fall.
The following table shows how the market capitalization of leading equity markets changed between 2011 and 2025.
YearEquity Market Cap ($T)
AustraliaCanadaChinaEUIndiaJapanUKU.S.
20111.21.93.46.02.03.53.315.6
20121.42.13.76.92.53.73.418.7
20131.42.13.98.62.34.54.424.0
20141.32.16.07.93.14.44.026.3
20151.21.68.27.63.04.93.925.1
20161.32.07.37.73.15.13.527.4
20171.52.48.79.84.76.24.532.1
20181.31.96.38.14.15.33.630.4
20191.52.48.69.74.36.24.234.1
20201.72.612.311.15.16.74.041.6
20211.93.314.413.87.16.53.848.5
20221.72.811.511.06.85.43.140.3
20231.83.110.912.68.76.14.549.0
20241.73.411.611.110.36.34.462.2
20252.04.615.515.510.67.65.668.9
Learn More on the Voronoi App
To explore the stocks that have powered U.S. market growth, check out The 10 Largest S&P 500 Stocks in 2025 on Voronoi.
Source: https://www.visualcapitalist.com/charted-the-worlds-largest-stock-markets-since-2011/
Related articles
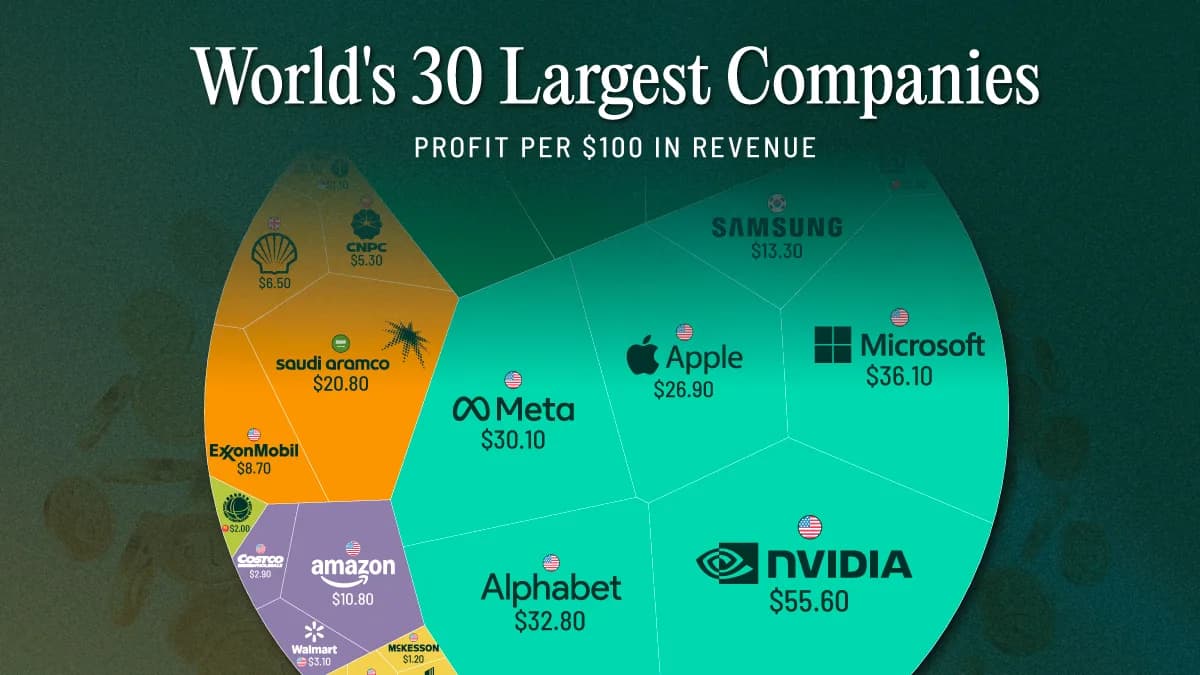
Ranked: Profit Margins of the World’s Largest Companies
Nvidia keeps nearly $56 of every $100 in revenue as profit. For some of the world’s largest companies, it’s less than $1.
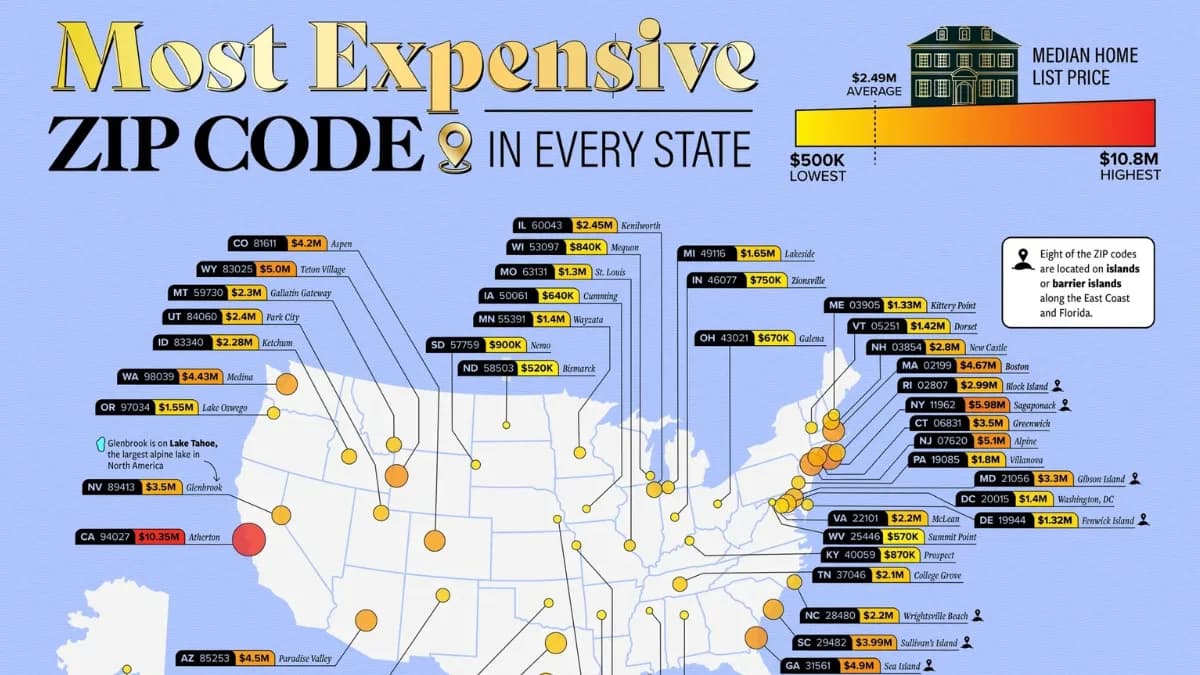
Mapped: The Most Expensive ZIP Code in Every State
Which ZIP codes have America’s priciest homes? See the most expensive location in every state based on median list prices.
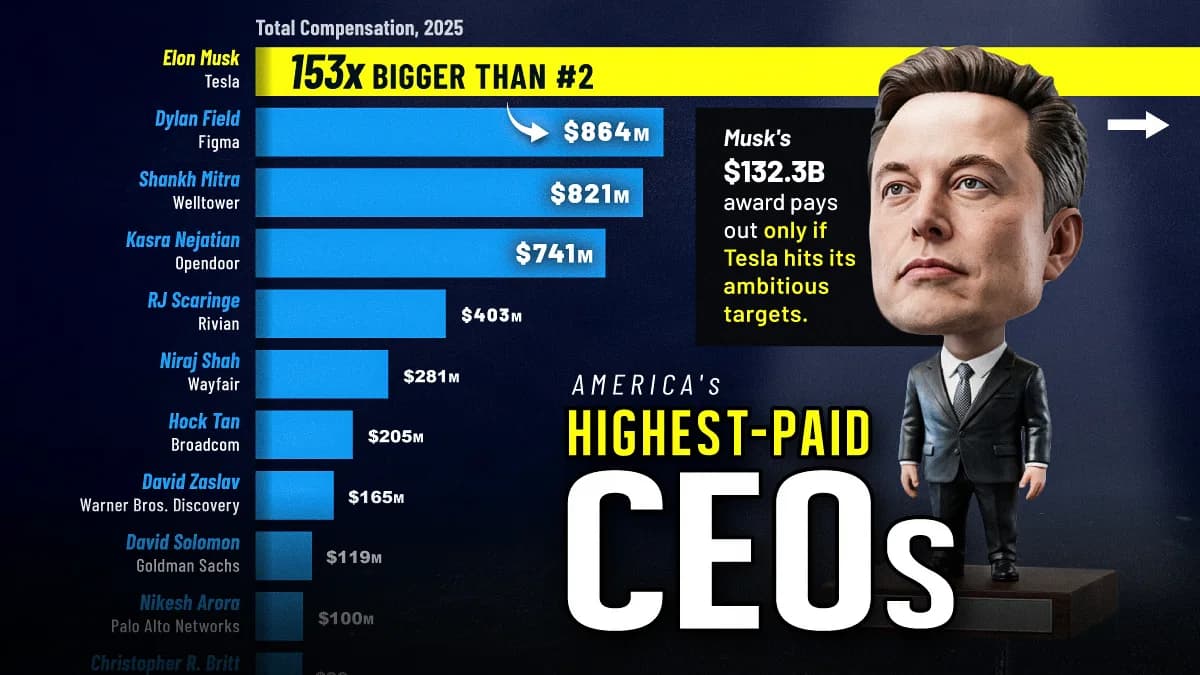
Ranked: America’s Highest-Paid CEOs in 2025
See America's highest-paid CEOs in 2025, led by Elon Musk's record $132.3 billion compensation package.

Where Work-Life Balance Is Best and Worst in the U.S.
Maine ranks first for work-life balance, while nine of the 10 lowest-ranked states are in the South. See how all 50 states compare.