
Ranked: Profit Margins of the World’s Largest Companies
Nvidia keeps nearly $56 of every $100 in revenue as profit. For some of the world’s largest companies, it’s less than $1.
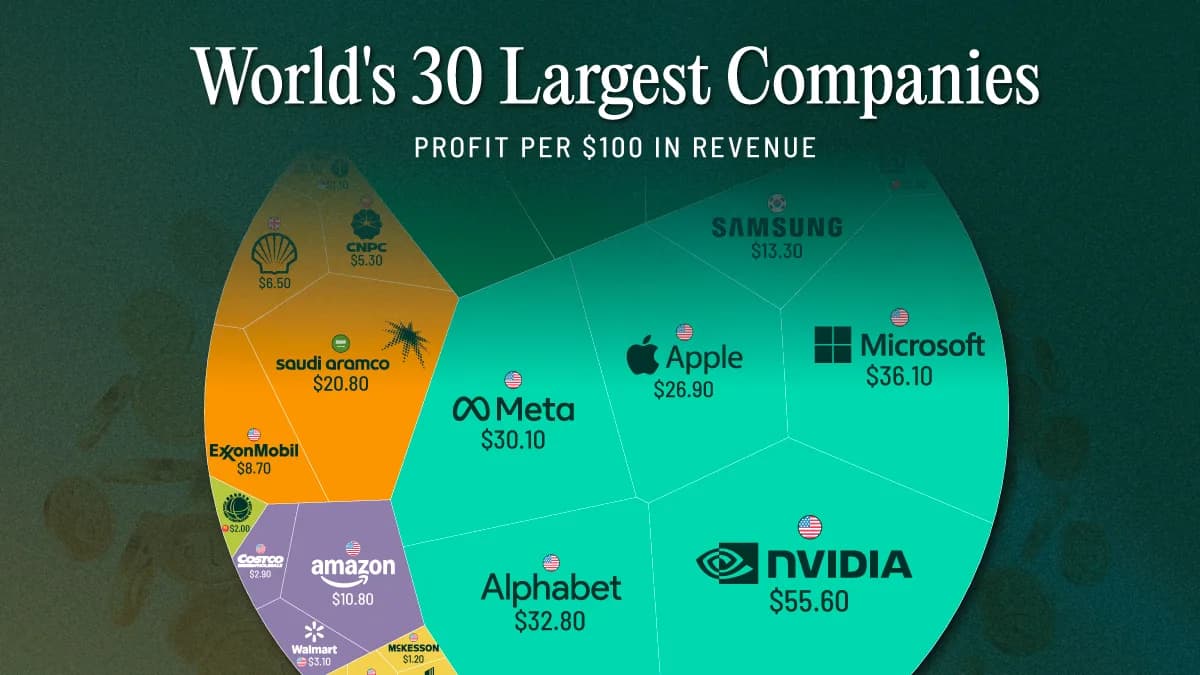
How Much Profit Do the World’s Biggest Companies Keep?
Key Takeaways
Nvidia generates $55.60 in profit for every $100 in revenue, the highest margin among the Fortune Global 500’s 30 largest companies.
Big Tech dominates the top of the ranking, with Microsoft, Alphabet, and Meta each keeping more than $30 of every $100 in revenue as profit.
At the other end, several of the world’s largest retailers, health care companies, and energy firms keep less than $5 per $100.
The world’s biggest companies generate enormous revenues, but the share that ultimately becomes profit varies widely.
This graphic ranks the world’s 30 largest companies by how much profit they generate for every $100 in revenue, based on Fortune Global 500 data. Profits are after taxes, extraordinary credits or charges, accounting changes, and noncontrolling interests, but before preferred dividends.
Why Tech Keeps More of Every $100
Revenue measures how much money flows through a company, but not how much ultimately reaches the bottom line. Across the world’s largest companies, Big Tech stands apart in how much of that revenue becomes profit.
RankNameProfit per $100 in Revenue (2026)Profit
1Nvidia$55.60$120B
2Microsoft$36.10$102B
3Alphabet$32.80$132B
4Meta$30.10$60B
5Apple$26.90$112B
6Industrial & Commercial Bank of China$24.30$51B
7Saudi Aramco$20.80$93B
8JPMorgan Chase$20.30$57B
9Berkshire Hathaway$18.00$67B
10Samsung Electronics$13.30$31B
11Amazon$10.80$78B
12ExxonMobil Holdings$8.70$29B
13Toyota Motor$7.60$26B
14Shell$6.50$18B
15China National Petroleum$5.30$21B
16Walmart$3.10$22B
17Costco Wholesale$2.90$8B
18UnitedHealth Group$2.70$12B
19Hon Hai Precision Industry$2.30$6B
20Volkswagen$2.30$8B
21Cigna Group$2.20$6B
22State Grid$2.00$11B
23Sinopec Group$1.40$5B
24McKesson$1.20$5B
25Trafigura Group$1.10$3B
26China State Construction Engineering$1.10$3B
27Cardinal Health$0.70$2B
28Cencora$0.50$2B
29CVS Health$0.40$2B
30Glencore$0.10$0.4B
Profits rounded to the nearest 10 cents.
The gap is striking even among corporate giants. Microsoft generates $36.10 in profit for every $100 in revenue, compared with roughly $3 for Walmart and Costco. Enormous revenue does not necessarily translate into an equally large profit margin.
Much of the difference comes down to business models. Software and digital platforms can serve additional customers at relatively low incremental cost, while retailers, manufacturers, and energy companies must continually pay for inventory, labor, raw materials, logistics, or production.
AI Is Rewriting Big Tech’s Business Model
The margins shown above reflect today’s business models, but AI is making many of those models more capital-intensive. Microsoft, Alphabet, Meta, and Amazon are pouring hundreds of billions of dollars into AI infrastructure. Hyperscaler capital spending is on track to reach $785 billion in 2026 and rise to nearly $1 trillion in 2027.
Nvidia is a major beneficiary of this investment. As a dominant supplier of AI chips, it sits at the center of the infrastructure buildout, while its CUDA software ecosystem can make switching to rival chips more difficult for developers.
On the flipside, the scale of AI investment is raising capital costs across Big Tech. As infrastructure spending climbs, those costs could begin to reshape the margins that currently put many tech companies near the top of this ranking.
Learn More on the Voronoi App
To learn more about this topic, check out this graphic on the world’s largest companies outside the U.S.
Related articles
Mapped: The Most Expensive ZIP Code in Every State
Which ZIP codes have America’s priciest homes? See the most expensive location in every state based on median list prices.
Ranked: America’s Highest-Paid CEOs in 2025
See America's highest-paid CEOs in 2025, led by Elon Musk's record $132.3 billion compensation package.
Where Work-Life Balance Is Best and Worst in the U.S.
Maine ranks first for work-life balance, while nine of the 10 lowest-ranked states are in the South. See how all 50 states compare.