
Ranked: Every Country by Life Expectancy in 2026
Monaco leads the world at 86.7 years, while Nigeria is last at 55. See life expectancy in all countries, and its growth since 1950.
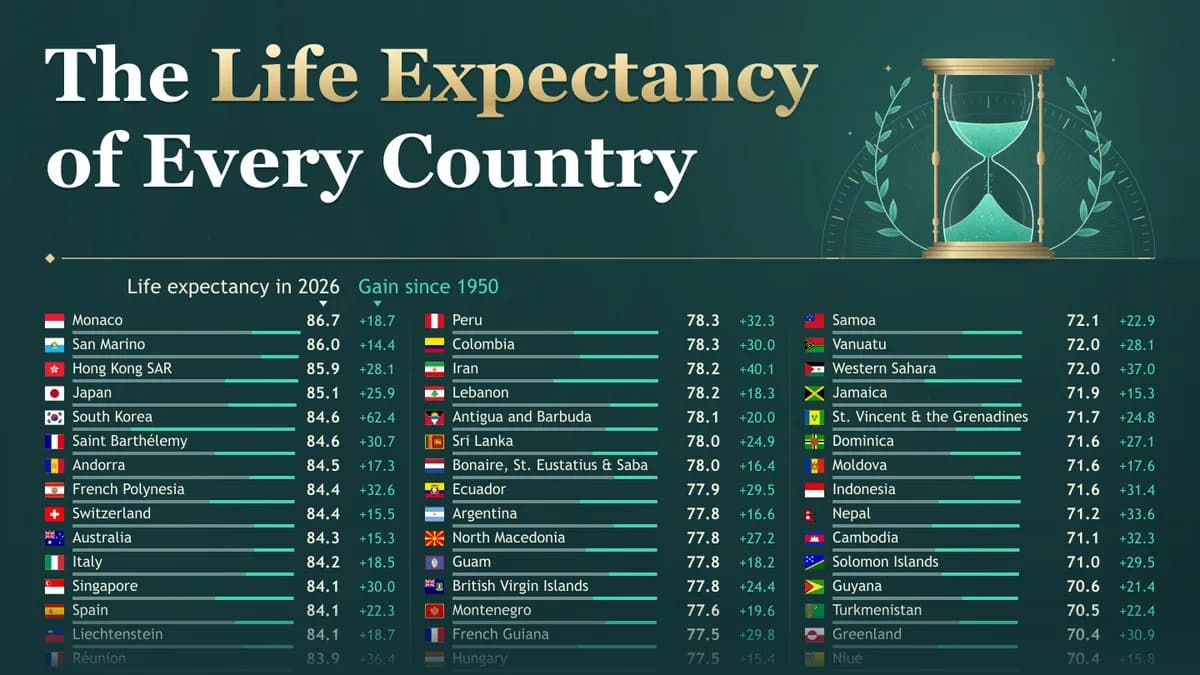
How Long Do People Live Around the World in 2026?
Key Takeaways
Monaco leads at 86.7 years, almost 32 years ahead of last-ranked Nigeria at 55.0.
The world’s average life expectancy in 2026 (73.8 years) is higher than that of any country or territory in 1950, when San Marino and Norway led at 71.6.
The U.S. ranks 64th at 79.8 years, trailing Chile (81.7), Costa Rica (81.4), and Albania (80.1). Its gain since 1950 is the sixth-smallest in the dataset.
Life expectancy has improved in every country and territory in this ranking since 1950, though progress has varied considerably.
This graphic ranks 237 countries and territories by life expectancy at birth in 2026 and shows their gains since 1950, using the United Nations’ World Population Prospects 2024 medium projections for 2026.
European Microstates and East Asia Lead Global Life Expectancy
Monaco has the highest life expectancy in the world at 86.7 years, followed by fellow European microstate San Marino at 86.0 years.
The next three places are in East Asia: Hong Kong (85.9), Japan (85.1), and South Korea (84.6). Heart health is one contributing factor, as Japan and South Korea have some of the lowest death rates from coronary heart disease in the OECD.
The table below shows life expectancy in 1950 and 2026 for all 237 countries and territories, along with the years gained:
RankCountry / TerritoryLife Expectancy in 1950 (Years)Life Expectancy in 2026 (Years)Gain Since 1950 (Years)
1 Monaco68.086.718.7
2 San Marino71.686.014.4
3 Hong Kong SAR57.885.928.1
4 Japan59.385.125.9
5 South Korea22.284.662.4
6 Saint Barthélemy54.084.630.7
7 Andorra67.284.517.3
8 French Polynesia51.984.432.6
9 Switzerland68.984.415.5
10 Australia69.084.315.3
11 Italy65.784.218.5
12 Singapore54.184.130.0
13 Spain61.884.122.3
14 Liechtenstein65.384.118.7
15 Réunion47.683.936.4
16 Gibraltar65.183.918.8
17 Malta63.583.820.3
18 Norway71.683.812.2
19 Sweden71.183.712.6
20 France66.483.717.3
21 Guernsey71.283.712.4
22 Macao SAR58.383.625.3
23 Holy See65.983.417.6
24 United Arab Emirates42.183.441.2
25 Iceland71.083.312.3
26 Canada68.283.114.8
27 Martinique55.083.028.1
28 Ireland65.682.917.3
29 Israel69.982.913.0
30 Portugal58.582.924.4
31 Qatar50.882.832.1
32 Bermuda60.482.822.5
33 Luxembourg65.582.617.1
34 Netherlands71.482.611.2
35 Belgium66.382.616.3
36 Guadeloupe53.182.629.5
37 New Zealand69.382.513.3
38 Austria64.882.517.6
39 Finland64.282.418.2
40 Greece66.282.416.2
41 Denmark70.382.412.1
42 Puerto Rico60.482.321.9
43 Cyprus55.882.226.3
44 Slovenia61.882.120.3
45 Germany66.881.915.1
46 United Kingdom68.681.713.1
47 Bahrain38.681.743.1
48 Maldives36.581.745.2
49 Chile53.281.728.6
50 Isle of Man63.181.418.3
51 Costa Rica57.581.423.9
52 Taiwan56.681.124.5
53 Kuwait49.781.031.2
54 Cayman Islands54.080.926.9
55 Saint Martin (French part)65.180.815.7
56 Faroe Islands60.680.820.2
57 Oman29.380.751.4
58 Czechia64.480.315.8
59 Panama55.480.124.7
60 Jersey69.480.110.7
61 Albania44.580.135.6
62 Anguilla55.179.924.8
63 Falkland Islands (Malvinas)49.579.830.3
64 United States68.179.811.7
65 Estonia66.479.613.3
66 Saudi Arabia40.079.439.4
67 New Caledonia45.179.234.1
68 Northern Mariana Islands58.279.221.0
69 Poland58.379.220.8
70 Croatia58.579.120.6
71 Wallis and Futuna Islands44.179.034.9
72 China43.879.035.2
73 Slovakia60.878.818.0
74 Cuba59.078.619.6
75 Uruguay65.678.613.0
76 Kosovo43.578.635.1
77 Turks and Caicos Islands48.678.529.9
78 Bosnia and Herzegovina47.378.431.1
79 Türkiye47.378.431.1
80 Jordan40.978.337.4
81 Peru46.078.332.3
82 Colombia48.378.330.0
83 Iran38.278.240.1
84 Lebanon59.978.218.3
85 Antigua and Barbuda58.178.120.0
86 Sri Lanka53.278.024.9
87 Bonaire, Sint Eustatius and Saba61.578.016.4
88 Ecuador48.477.929.5
89 Argentina61.377.816.6
90 North Macedonia50.677.827.2
91 Guam59.677.818.2
92 British Virgin Islands53.377.824.4
93 Montenegro58.077.619.6
94 French Guiana47.777.529.8
95 Hungary62.177.515.4
96 State of Palestine45.777.431.7
97 Tokelau54.777.422.7
98 Curaçao60.377.317.1
99 Serbia55.177.322.2
100 Saint Helena66.077.311.3
101 Saint Pierre and Miquelon62.977.314.3
102 Malaysia48.577.228.7
103 Tunisia38.277.138.9
104 Thailand45.277.131.9
105 Algeria42.776.934.2
106 Sint Maarten (Dutch part)62.476.914.4
107 Aruba58.076.818.8
108 Montserrat48.676.728.1
109 Barbados53.676.623.1
110 Latvia64.676.612.1
111 Mayotte42.276.634.4
112 Cabo Verde44.976.631.6
113 Lithuania66.176.510.4
114 Romania60.576.415.9
115 Brazil48.576.427.8
116 Armenia54.676.221.6
117 United States Virgin Islands59.976.216.3
118 Bulgaria61.576.114.7
119 Morocco38.875.937.1
120 Cook Islands37.975.837.9
121 Brunei50.675.825.3
122 Grenada52.775.722.9
123 Mexico43.875.631.8
124 Bangladesh37.475.538.1
125 Mauritius51.975.423.5
126 Nicaragua40.675.434.8
127 Libya33.175.242.1
128 Vietnam48.075.027.0
129 Ukraine61.275.013.8
130 Bahamas58.975.016.1
131 Georgia57.775.017.3
132 Belarus58.675.016.3
133 Azerbaijan46.374.928.6
134 Kazakhstan55.674.819.2
135 Paraguay58.174.216.2
136 Dominican Republic44.174.130.1
137 Belize49.274.124.9
138 Suriname50.774.023.3
139 North Korea14.274.059.8
140 Trinidad and Tobago57.073.916.9
141 Bhutan35.373.838.5
142 Russia55.573.718.2
143 Syria42.573.431.0
144 Tonga48.473.425.0
145 Honduras41.073.432.3
146 Seychelles57.873.315.5
147 American Samoa59.273.314.1
148 Saint Lucia48.373.224.9
149 Guatemala37.873.035.2
150 Venezuela51.173.021.9
151 Uzbekistan53.372.819.4
152 El Salvador44.272.728.5
153 India41.272.731.5
154 Iraq37.472.635.2
155 Saint Kitts and Nevis54.872.617.8
156 Mongolia38.672.533.9
157 Tajikistan49.372.222.8
158 Egypt34.072.238.2
159 Kyrgyzstan52.172.120.0
160 Samoa49.272.122.9
161 Vanuatu43.972.028.1
162 Western Sahara34.972.037.0
163 Jamaica56.671.915.3
164 Saint Vincent and the Grenadines46.971.724.8
165 Dominica44.571.627.1
166 Moldova54.071.617.6
167 Indonesia40.271.631.4
168 Nepal37.671.233.6
169 Cambodia38.971.132.3
170 Solomon Islands41.471.029.5
171 Guyana49.270.621.4
172 Turkmenistan48.170.522.4
173 Greenland39.570.430.9
174 Niue54.670.415.8
175 Sao Tome and Principe39.170.331.1
176 Philippines53.670.216.6
177 Yemen28.969.740.8
178 Laos38.969.730.8
179 Palau52.769.616.9
180 Botswana46.269.623.4
181 Eritrea33.369.436.1
182 Senegal36.569.432.9
183 Mauritania38.469.230.8
184 Bolivia40.769.128.4
185 Uganda39.768.929.2
186 Gabon39.368.929.6
187 Rwanda43.268.525.3
188 Timor-Leste29.268.339.2
189 Ethiopia35.568.132.6
190 Pakistan34.268.133.8
191 Malawi32.767.935.3
192 Namibia41.967.825.9
193 Fiji51.767.816.1
194 Micronesia48.467.719.3
195 Tanzania41.067.626.6
196 Tuvalu40.067.627.6
197 Myanmar35.767.531.8
198 Comoros37.467.530.1
199 Marshall Islands52.667.314.7
200 Sudan45.866.921.1
201 Zambia46.866.920.1
202 Kiribati45.766.921.1
203 Afghanistan28.266.838.6
204 South Africa43.166.723.5
205 Djibouti40.766.625.9
206 Papua New Guinea39.466.527.1
207 Gambia31.266.535.3
208 Republic of the Congo39.666.426.8
209 Ghana43.166.123.0
210 Haiti37.265.528.2
211 Angola35.965.229.3
212 Guinea-Bissau35.764.628.9
213 Eswatini43.464.521.1
214 Cameroon33.164.531.4
215 Equatorial Guinea40.164.324.2
216 Madagascar39.764.324.6
217 Kenya36.964.227.3
218 Mozambique37.364.126.8
219 Burundi40.964.123.2
220 Zimbabwe49.463.614.2
221 Togo41.963.321.4
222 Liberia38.062.624.7
223 Naoero56.662.66.0
224 Côte d'Ivoire30.862.431.6
225 DR Congo38.262.424.2
226 Sierra Leone28.962.333.4
227 Niger35.961.926.0
228 Burkina Faso33.061.628.6
229 Benin35.461.325.9
230 Guinea35.661.225.6
231 Mali28.761.132.4
232 Somalia41.559.317.8
233 Lesotho44.658.614.0
234 Central African Republic35.458.222.7
235 South Sudan30.258.027.8
236 Chad35.255.620.4
237 Nigeria35.555.019.4
Life expectancy of at least 80 years has become much more widespread. There are now 61 countries and territories at that level, compared with none in 1950.
The U.S. has experienced a substantial drop in the rankings. In 1950, it ranked 15th at 68.1 years. By 2026, it had fallen to 64th, despite life expectancy rising to 79.8 years.
Its gain of just 11.7 years is the sixth-smallest among all 237 countries and territories. Canada, which started at a similar level in 1950, has gained 14.8 years and now ranks 26th at 83.1 years.
Where Life Expectancy Grew the Most Since 1950
Global life expectancy has risen from 46.4 years to 73.8 years since 1950, a gain of 27.4 years. Vaccination has helped more children survive, and a WHO-led study found that immunization reduced infant deaths by 40% between 1974 and 2024.
South Korea recorded the largest gain, rising from 22.2 years to 84.6 years. Its starting point coincided with the outbreak of the Korean War, and it has since climbed from second-to-last to fifth among the world’s longest-living countries.
Gulf oil states account for four of the 10 largest gains, including Oman, where life expectancy rose from 29.3 to 80.7 years. The UN credits Oman’s investment of energy earnings in education and public health as a driver of its development gains.
All 10 lowest-ranked countries and territories are in sub-Saharan Africa, with Nigeria last at 55.0 years and Chad just above it at 55.6.
Child mortality remains a major factor. About one in 10 Nigerian children die before their fifth birthday, compared with roughly two in 1,000 in Japan, according to the UN’s projections for 2026.
The historical comparison is striking: despite gaining 19.4 years since 1950, Nigeria’s life expectancy in 2026 remains below the 59.3 years Japan had already reached in 1950.
Learn More on the Voronoi App
If you enjoyed today’s post, check out Countries With the Biggest Gains in Life Expectancy on Voronoi.
Get the latest news delivered to your inbox.
Related articles