Ranked: The World’s Most and Least Miserable Economies
Explore the world's most miserable economies in 2025, ranked by inflation, unemployment, lending rates, and economic growth across 178 economies.
Which Economies Are the Most and Least Miserable?
Key Takeaways
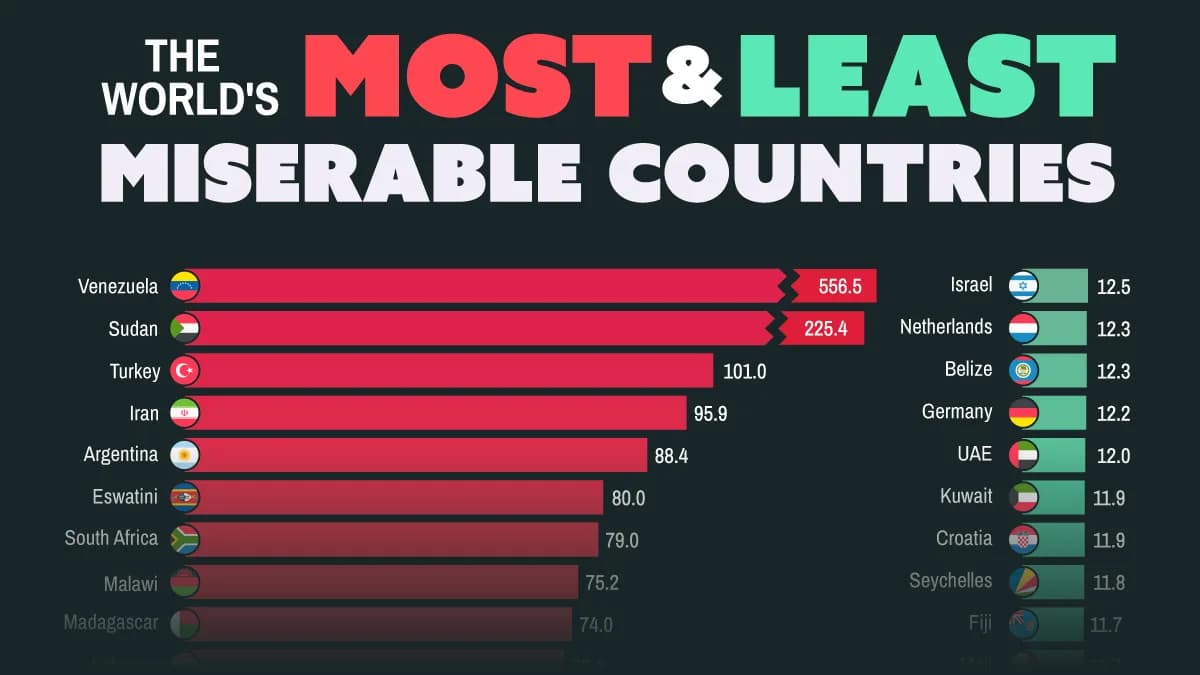
Venezuela has the highest Misery Index score among 178 economies, at 556.5, more than twice Sudan’s score of 225.4.
Taiwan, Singapore, and Thailand have the lowest scores in the 2025 ranking.
Bank lending rates are the largest contributing factor for 105 economies, compared with 54 for unemployment and 19 for inflation.
What makes an economy miserable? Under the Misery Index, the answer comes down to economic pressures such as inflation, unemployment, and borrowing costs. The biggest challenges vary considerably from country to country.
This visualization ranks 178 economies using the 2025 Hanke Annual Misery Index, which combines inflation, unemployment, bank lending rates, and real GDP per capita growth into a single score.
Ranking All 178 Economies by Economic Misery
The visualization highlights selected economies at both ends of the ranking. The complete table below includes all 178 economies, allowing readers to find those not shown in the graphic.
Scores are ordered from highest to lowest, with rank 1 representing the greatest economic misery under the index.
Rank (Most Miserable to Least)CountryMisery Index
1 Venezuela556.5
2 Sudan225.4
3 Turkey101.0
4 Iran95.9
5 Argentina88.4
6 Eswatini80.0
7 South Africa79.0
8 Malawi75.2
9 Madagascar74.0
10 Lebanon72.4
11 Haiti72.4
12 Angola72.3
13 Yemen71.0
14 Myanmar65.9
15 Zimbabwe64.7
16 Djibouti60.6
17 Botswana60.1
18 Bosnia and Hercegovina59.7
19 Brazil59.6
20 Gabon58.6
21 Ukraine55.6
22 Palestinian Territories52.5
23 Namibia50.8
24 Congo (brazzaville)49.8
25 Lesotho48.5
26 Egypt46.5
27 São Tomé and Príncipe45.8
28 Bolivia44.0
29 Tunisia43.9
30 Suriname43.6
31 Iraq42.0
32 Jordan41.3
33 Syria41.2
34 Georgia40.0
35 St. Vincent and the Grenadines39.1
36 Rwanda38.9
37 Nigeria37.9
38 Mauritania37.8
39 Kazakhstan37.8
40 Cuba37.4
41 Mozambique37.3
42 Congo (Democratic Republic)36.9
43 Uzbekistan36.5
44 Libya36.0
45 Pakistan35.7
46 Colombia35.6
47 Tajikistan35.5
48 The Gambia34.2
49 Honduras34.0
50 Ghana33.0
51 Equatorial Guinea32.9
52 Armenia32.8
53 Zambia31.7
54 Burundi31.0
55 Mongolia30.6
56 Nepal30.3
57 Guinea30.2
58 Azerbaijan30.0
59 Russia29.3
60 Romania29.2
61 Central African Republic29.1
62 Sierra Leone29.1
63 Dominican Republic28.5
64 Ethiopia28.5
65 Kenya28.1
66 Cabo Verde27.4
67 North Macedonia27.4
68 Montenegro27.1
69 Kyrgyz Republic26.8
70 Algeria26.8
71 Uruguay26.5
72 St. Lucia26.4
73 Estonia25.6
74 Paraguay25.4
75 Turkmenistan25.1
76 Spain25.0
77 New Zealand24.2
78 Chile24.0
79 Serbia24.0
80 Bangladesh23.5
81 Peru23.3
82 Iceland23.1
83 Uganda23.1
84 Jamaica23.1
85 Sweden23.1
86 India22.9
87 Finland22.9
88 Greece22.0
89 Bahamas21.9
90 Mauritius21.8
91 Austria21.3
92 Morocco21.0
93 Belarus21.0
94 Chad20.9
95 Albania20.8
96 Liberia20.6
97 Guyana20.2
98 Canada20.1
99 Latvia20.1
100 Vanuatu20.1
101 Barbados20.1
102 Moldova20.0
103 United Kingdom19.6
104 Australia19.3
105 Hungary19.2
106 Grenada19.1
107 Tanzania19.1
108 Panama18.6
109 Saudi Arabia18.5
110 Trinidad and Tobago18.4
111 Norway18.2
112 Lithuania18.2
113 Mexico18.0
114 Luxembourg17.8
115 France17.8
116 Brunei Darussalam17.3
117 Portugal17.2
118 Bhutan17.2
119 United States of America17.0
120 Cameroon17.0
121 Comoros16.9
122 Slovakia16.9
123 Indonesia16.8
124 Belgium16.8
125 Poland16.7
126 Guatemala16.6
127 Italy16.5
128 Maldives16.1
129 Laos15.7
130 Bulgaria15.7
131 Philippines15.5
132 Samoa15.4
133 Papua New Guinea15.2
134 Sri Lanka15.1
135 Costa Rica15.0
136 Oman15.0
137 Cyprus15.0
138 El Salvador14.8
139 Aruba14.7
140 Nicaragua14.5
141 Ecuador14.4
142 Slovenia13.0
143 Solomon Islands12.7
144 Israel12.5
145 Netherlands12.3
146 Belize12.3
147 Germany12.2
148 United Arab Emirates12.0
149 Kuwait11.9
150 Croatia11.9
151 Seychelles11.8
152 Fiji11.7
153 Mali11.7
154 Tonga11.3
155 South Korea11.0
156 Vietnam10.7
157 Niger10.2
158 Hong Kong10.0
159 Denmark10.0
160 Bahrain9.7
161 Malta9.5
162 Togo9.4
163 Cambodia8.8
164 China8.7
165 Senegal8.7
166 Czech Republic8.5
167 Malaysia8.5
168 Switzerland7.8
169 Guinea-Bissau7.4
170 Burkina Faso7.4
171 Qatar7.2
172 Japan7.2
173 Macau6.7
174 Côte D’ivoire6.3
175 Ireland5.3
176 Thailand3.1
177 Singapore2.6
178 Taiwan2.1
Venezuela tops the ranking with a score of 556.5, followed by Sudan at 225.4. Türkiye ranks third at 101.0, with Iran and Argentina completing the five highest-scoring economies.
Venezuela’s exceptionally high score is largely tied to inflation. Hanke reports that consumer prices rose 475.3% in 2025, alongside an unemployment rate of 35.1%.
Sudan’s economy has also been affected by civil war, which has disrupted economic activity and employment. Its Misery Index score is more than twice that of third-ranked Türkiye.
The United States ranks 119th with a score of 17.0, while Canada ranks 98th at 20.1. The United Kingdom and Australia place 103rd and 104th, respectively, with scores below 20.
Why Do Economies Score Poorly on the Misery Index?
Countries with high Misery Index scores aren’t necessarily struggling with the same economic problems. Inflation is the largest contributing factor in Venezuela, Sudan, Iran, and Argentina, while unemployment leads in South Africa and Eswatini.
Our map of global inflation rates in 2025 provides a closer look at how consumer prices changed around the world, including in several of the highest-scoring economies.
Türkiye presents a different case. Although it ranks third overall, bank lending rates are its largest contributing factor. The same is true for Brazil, which ranks 19th with a score of 59.6.
Across the full dataset, lending rates are the largest contributor for 105 of the 178 economies. Unemployment leads in 54 economies, while inflation leads in 19.
The second table lists every economy alongside the factor identified as contributing most to its Misery Index score.
CountryMisery IndexMajor Contributing Factor
Venezuela556.5Inflation
Sudan225.4Inflation
Turkey101.0Lending rate
Iran95.9Inflation
Argentina88.4Inflation
Eswatini80.0Unemployment
South Africa79.0Unemployment
Malawi75.2Inflation
Madagascar74.0Lending rate
Lebanon72.4Unemployment
Haiti72.4Inflation
Angola72.3Lending rate
Yemen71.0Lending rate
Myanmar65.9Inflation
Zimbabwe64.7Lending rate
Djibouti60.6Unemployment
Botswana60.1Unemployment
Bosnia and Hercegovina59.7Unemployment
Brazil59.6Lending rate
Gabon58.6Unemployment
Ukraine55.6Lending rate
Palestinian Territories52.5Inflation
Namibia50.8Unemployment
Congo (brazzaville)49.8Unemployment
Lesotho48.5Unemployment
Egypt46.5Unemployment
São Tomé and Príncipe45.8Lending rate
Bolivia44.0Inflation
Tunisia43.9Unemployment
Suriname43.6Lending rate
Iraq42.0Unemployment
Jordan41.3Unemployment
Syria41.2Unemployment
Georgia40.0Lending rate
St. Vincent and the Grenadines39.1Unemployment
Rwanda38.9Lending rate
Nigeria37.9Inflation
Mauritania37.8Lending rate
Kazakhstan37.8Lending rate
Cuba37.4Inflation
Mozambique37.3Lending rate
Congo (Democratic Republic)36.9Lending rate
Uzbekistan36.5Lending rate
Libya36.0Unemployment
Pakistan35.7Lending rate
Colombia35.6Lending rate
Tajikistan35.5Lending rate
The Gambia34.2Inflation
Honduras34.0Lending rate
Ghana33.0Lending rate
Equatorial Guinea32.9Unemployment
Armenia32.8Lending rate
Zambia31.7Inflation
Burundi31.0Inflation
Mongolia30.6Lending rate
Nepal30.3Unemployment
Guinea30.2Lending rate
Azerbaijan30.0Lending rate
Russia29.3Lending rate
Romania29.2Lending rate
Central African Republic29.1Lending rate
Sierra Leone29.1Lending rate
Dominican Republic28.5Lending rate
Ethiopia28.5Inflation
Kenya28.1Lending rate
Cabo Verde27.4Unemployment
North Macedonia27.4Unemployment
Montenegro27.1Unemployment
Kyrgyz Republic26.8Lending rate
Algeria26.8Unemployment
Uruguay26.5Lending rate
St. Lucia26.4Unemployment
Estonia25.6Lending rate
Paraguay25.4Lending rate
Turkmenistan25.1Lending rate
Spain25.0Unemployment
New Zealand24.2Lending rate
Chile24.0Unemployment
Serbia24.0Unemployment
Bangladesh23.5Inflation
Peru23.3Lending rate
Iceland23.1Lending rate
Uganda23.1Lending rate
Jamaica23.1Lending rate
Sweden23.1Unemployment
India22.9Lending rate
Finland22.9Unemployment
Greece22.0Unemployment
Bahamas21.9Unemployment
Mauritius21.8Lending rate
Austria21.3Unemployment
Morocco21.0Unemployment
Belarus21.0Lending rate
Chad20.9Lending rate
Albania20.8Unemployment
Liberia20.6Lending rate
Guyana20.2Unemployment
Canada20.1Lending rate
Latvia20.1Unemployment
Vanuatu20.1Unemployment
Barbados20.1Lending rate
Moldova20.0Lending rate
United Kingdom19.6Lending rate
Australia19.3Lending rate
Hungary19.2Lending rate
Grenada19.1Unemployment
Tanzania19.1Lending rate
Panama18.6Lending rate
Saudi Arabia18.5Unemployment
Trinidad and Tobago18.4Lending rate
Norway18.2Lending rate
Lithuania18.2Unemployment
Mexico18.0Lending rate
Luxembourg17.8Unemployment
France17.8Unemployment
Brunei Darussalam17.3Lending rate
Portugal17.2Unemployment
Bhutan17.2Lending rate
United States of America17.0Lending rate
Cameroon17.0Lending rate
Comoros16.9Lending rate
Slovakia16.9Unemployment
Indonesia16.8Lending rate
Belgium16.8Unemployment
Poland16.7Lending rate
Guatemala16.6Lending rate
Italy16.5Unemployment
Maldives16.1Lending rate
Laos15.7Lending rate
Bulgaria15.7Unemployment
Philippines15.5Lending rate
Samoa15.4Lending rate
Papua New Guinea15.2Lending rate
Sri Lanka15.1Lending rate
Costa Rica15.0Lending rate
Oman15.0Lending rate
Cyprus15.0Lending rate
El Salvador14.8Lending rate
Aruba14.7Lending rate
Nicaragua14.5Lending rate
Ecuador14.4Lending rate
Slovenia13.0Unemployment
Solomon Islands12.7Lending rate
Israel12.5Lending rate
Netherlands12.3Lending rate
Belize12.3Lending rate
Germany12.2Unemployment
United Arab Emirates12.0Lending rate
Kuwait11.9Lending rate
Croatia11.9Unemployment
Seychelles11.8Lending rate
Fiji11.7Unemployment
Mali11.7Lending rate
Tonga11.3Inflation
South Korea11.0Lending rate
Vietnam10.7Lending rate
Niger10.2Inflation
Hong Kong10.0Lending rate
Denmark10.0Lending rate
Bahrain9.7Lending rate
Malta9.5Unemployment
Togo9.4Lending rate
Cambodia8.8Lending rate
China8.7Unemployment
Senegal8.7Lending rate
Czech Republic8.5Lending rate
Malaysia8.5Lending rate
Switzerland7.8Lending rate
Guinea-Bissau7.4Lending rate
Burkina Faso7.4Lending rate
Qatar7.2Lending rate
Japan7.2Inflation
Macau6.7Lending rate
Côte D’ivoire6.3Lending rate
Ireland5.3Lending rate
Thailand3.1Lending rate
Singapore2.6Lending rate
Taiwan2.1Unemployment
These results show why economies with similar scores may face very different challenges. Some struggle primarily with unemployment, while others face rapid price increases or high borrowing costs.
The contributing-factor column identifies the largest component of each score, not the only economic pressure affecting a country.
Which Economies Have the Lowest Misery Index Scores?
Taiwan has the lowest Misery Index score among all 178 economies, at just 2.1. Singapore follows at 2.6, while Thailand ranks third-lowest at 3.1.
Ireland is next at 5.3, followed by Côte d’Ivoire at 6.3 and Macau at 6.7.
Taiwan’s position reflects a combination of relatively favorable economic indicators, including strong real GDP per capita growth. Hanke’s analysis links its economic performance to demand for semiconductors and AI-related hardware.
Even low-scoring economies have economic pressures. Unemployment is Taiwan’s largest contributing factor, while lending rates lead in Singapore, Thailand, and Ireland.
A low score does not mean an economy has no problems. It means its combined result is lower than those of other economies under this particular formula.
How Is the Misery Index Calculated?
Economist Arthur Okun originally developed the Misery Index by combining inflation and unemployment.
Hanke’s version adds bank lending rates and real GDP per capita growth. Its formula is inflation plus twice the unemployment rate plus lending rates, minus real GDP per capita growth.
Because unemployment receives double weight, changes in employment conditions can have a larger effect on the index than equivalent changes in inflation.
The index measures selected macroeconomic pressures rather than happiness, life satisfaction, or overall living standards. It is a tool for comparing economic conditions, not a direct measure of how people feel about their lives.
Learn More on the Voronoi App
If you enjoyed this visualization, check out The $128 Trillion Global Economy: Every Country’s GDP Ranked on the Voronoi app.
Get the latest news delivered to your inbox.
Related articles