Mapped: Average Salary by State in 2026
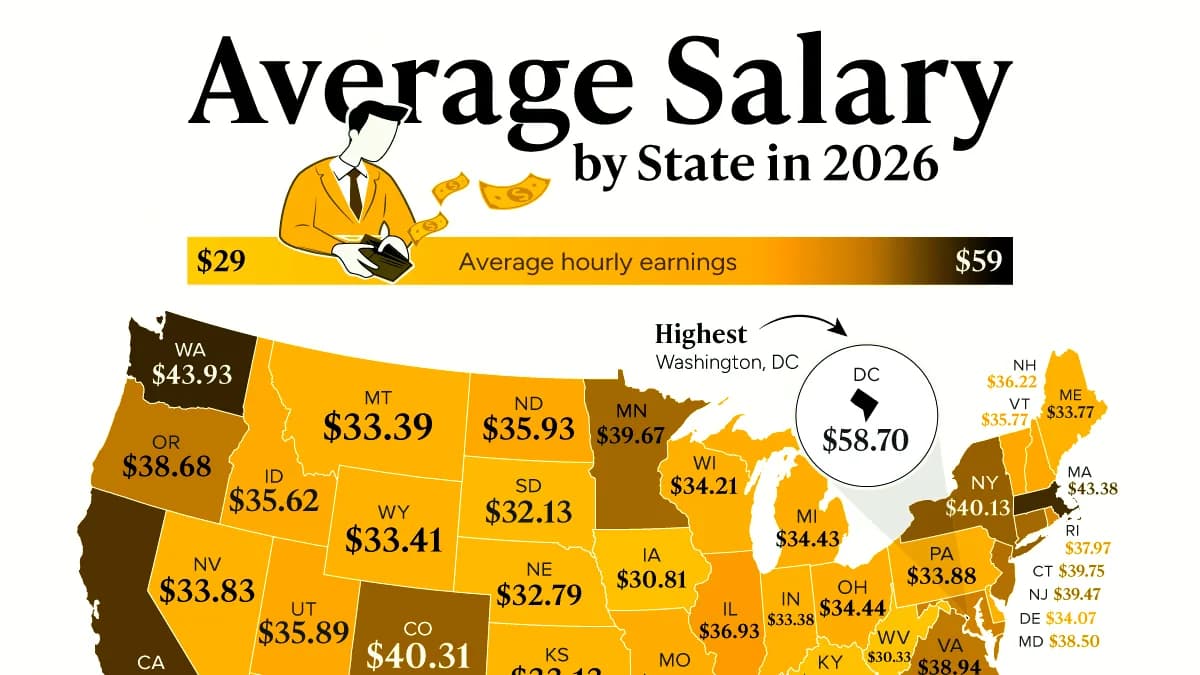
This map shows average hourly earnings across all 50 states and Washington, D.C., in August 2026.
How Much Do Americans Earn Per Hour in Each State?
Key Takeaways
Washington, D.C. has the highest average hourly earnings at $58.70, nearly double Mississippi’s $29.52.
The Northeast and West generally lead in hourly earnings, while many Southern states rank near the bottom.
The national average reached $37.79 per hour in August 2026, up nearly 8% from two years earlier.
Washington, D.C. leads the country in average hourly earnings, but among the 50 states, it’s Washington State that takes the top spot at $43.93 per hour.
This map compares average hourly earnings across all 50 states and Washington, D.C., revealing a nearly $30 gap between the highest- and lowest-paying jurisdictions.
The data comes from the U.S. Bureau of Labor Statistics and covers private-sector workers in August 2026, using non-seasonally adjusted figures.
The Northeast and West Lead in Earnings
Washington, D.C. stands well above every state, with average hourly earnings of $58.70, nearly $15 higher than second-place Washington state ($43.93).
Among states, Washington ranks first, followed by Massachusetts ($43.38) and California ($42.54). These states have large concentrations of relatively high-paying industries, including technology, finance, and professional services.
RankState or DistrictAverage hourly earnings
1D.C.$58.70
2Washington$43.93
3Massachusetts$43.38
4California$42.54
5Hawaii$40.76
6Colorado$40.31
7New York$40.13
8Connecticut$39.75
9Minnesota$39.67
10New Jersey$39.47
11Virginia$38.94
12Oregon$38.68
13Maryland$38.50
14Alaska$38.17
15Rhode Island$37.97
16Illinois$36.93
17Arizona$36.54
18Florida$36.37
19Texas$36.37
20New Hampshire$36.22
21Georgia$36.10
22North Dakota$35.93
23Utah$35.89
24Vermont$35.77
25Idaho$35.62
26North Carolina$34.61
27Ohio$34.44
28Michigan$34.43
29Missouri$34.43
30Wisconsin$34.21
31Delaware$34.07
32Pennsylvania$33.88
33Nevada$33.83
34Maine$33.77
35Wyoming$33.41
36Montana$33.39
37Indiana$33.38
38Kansas$33.13
39South Carolina$33.13
40Nebraska$32.79
41Alabama$32.54
42Oklahoma$32.30
43South Dakota$32.13
44Tennessee$32.07
45New Mexico$31.32
46Louisiana$31.19
47Iowa$30.81
48Kentucky$30.79
49West Virginia$30.33
50Arkansas$30.05
51Mississippi$29.52
-- National Average$37.79
The broader regional pattern reflects these strengths, with the Northeast averaging $37.82 per hour across its states, followed by the West at $37.26.
However, higher nominal wages do not necessarily translate into greater purchasing power, particularly in expensive metropolitan areas.
There is also considerable variation within regions, with New Mexico averaging just $31.32 per hour despite belonging to the West.
Southern States Tend to Have Lower Wages
Mississippi has the country’s lowest average hourly earnings at $29.52, followed by Arkansas ($30.05) and West Virginia ($30.33).
Several other Southern states, including Louisiana ($31.19) and Alabama ($32.54), also rank near the bottom.
Still, the South is far from uniform. Virginia averages $38.94 per hour, above the national average of $37.79, while Texas and Florida both come in at $36.37.
The Midwest also shows substantial differences, ranging from Minnesota’s $39.67 to Iowa’s $30.81.
Average Hourly Earnings Continue to Rise Nationwide
Across the U.S., average hourly earnings in the private sector reached $37.79 in August 2026, up from $36.41 in 2025 and $35.02 in 2024.
This represents an increase of nearly 8% over two years. However, inflation has offset some of these nominal gains, meaning purchasing power has not increased at the same rate.
Higher Wages Come With Higher Tax Bills
Higher earnings don’t always mean more money in workers’ pockets, as taxes also vary significantly across states.
New Jersey, for example, has the highest estimated lifetime tax bill at $1.36 million, followed by Massachusetts at $1.30 million. In contrast, Florida has the lowest at approximately $509,000.
These differences reflect both regional tax policies and income levels. While lifetime tax estimates are not directly comparable to hourly earnings, they illustrate another factor that can influence workers’ finances.
Ultimately, higher wages don’t necessarily translate into greater purchasing power once taxes and living expenses are considered.
Learn More on the Voronoi App
If you enjoyed today’s post, check out Mapped: What a Home Is Worth in Every U.S. State in 2026 on Voronoi.
Get the latest news delivered to your inbox.
Related articles