Mapped: Where Americans Pay the Most for Drinking Water
Why does water cost so much in some states? Explore the nearly fivefold gap in annual bills and the forces driving prices higher.
Where Americans Pay the Most for Water
Key Takeaways
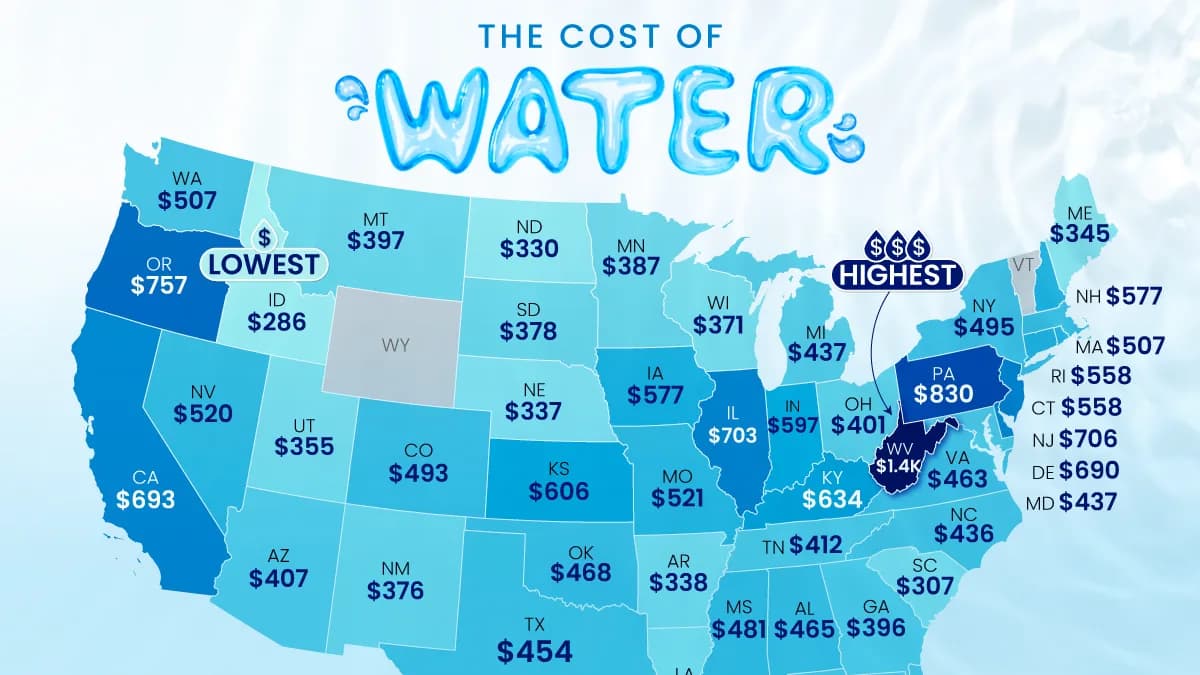
West Virginia has the highest average annual drinking water bills at $1,383, nearly five times Idaho’s $286.
Despite abundant freshwater resources, West Virginia saw average water rates rise 95% over the past decade.
Nationwide, average water bills rose 62% between 2015 and 2025, more than double the 30% increase in grocery prices.
Americans can pay dramatically different amounts for the same quantity of drinking water, depending on where they live. Across U.S. states, average annual bills range from less than $300 to nearly $1,400.
This graphic maps average annual drinking water bills in 2025, using Food & Water Watch data covering 500 of the largest public and private community water systems in the country. Estimates assume 60,000 gallons per household annually and exclude sewer and stormwater charges.
How Water Bills Compare Across U.S. States
The table below ranks states by average annual drinking water bills in 2025, based on the water systems analyzed.
RankStateAverage annual drinking water bill (2025)
1West Virginia$1,383.27
2Pennsylvania$829.60
3Alaska$784.56
4Oregon$757.12
5New Jersey$706.45
6Illinois$703.22
7California$693.19
8Delaware$690.12
9Kentucky$634.37
10Kansas$605.99
11Indiana$596.50
12Iowa$577.04
13New Hampshire$576.70
14Connecticut$558.20
14Rhode Island$558.20
16Hawaii$555.72
17Missouri$520.56
18Nevada$520.10
19Massachusetts$507.19
20Washington$506.94
21New York$495.34
22Colorado$492.85
23Mississippi$480.64
24Oklahoma$467.97
25Alabama$465.01
26Virginia$463.33
27Texas$453.82
28Maryland$437.40
29Michigan$436.83
30North Carolina$436.06
31Florida$414.60
32Tennessee$411.82
33Arizona$407.28
34Ohio$401.47
35Montana$397.20
36Georgia$396.06
37Minnesota$386.67
38South Dakota$378.41
39New Mexico$376.10
40Wisconsin$370.97
41Utah$354.70
42Maine$345.29
43Arkansas$338.16
44Nebraska$337.31
45North Dakota$330.00
46Louisiana$318.32
47South Carolina$306.54
48Idaho$285.61
-- U.S. Average$531
West Virginia’s annual water bills average more than double the U.S. average of $531. Aging infrastructure and population decline have left fewer customers to shoulder maintenance costs, helping explain the state’s steep rate increases.
For low-income households served by its largest systems, water bills consume 11% of household income. Pennsylvania ($830), Alaska ($785), and Oregon ($757) round out the four most expensive states.
Ownership adds another dimension. Privately owned systems charged an average of $823 annually, compared with $494 for publicly owned systems. Over the past decade, water bills also outpaced overall inflation (39%) and grocery prices (30%).
Why Water Scarcity Could Make Bills Even Higher
While West Virginia’s costs reflect aging infrastructure and a shrinking customer base, the Southwest faces a different challenge: securing enough water for the future. The Colorado River serves more than 40 million people, with prolonged drought putting pressure on water supplies.
California ranks seventh overall, yet 13 of the 25 most expensive water systems are located in the state. In San Jose, one privately owned system charged $1,416 annually, more than ten times the $133 charged by a public system in Hempstead, New York.
U.S. drinking water systems face an estimated $625 billion in infrastructure needs over two decades. For households, using less water doesn’t necessarily mean lower bills. Utilities must still maintain pipes, treatment facilities, and reliable supplies, even when consumption falls.
Learn More on the Voronoi App
To learn more about global water resources, check out this graphic comparing water use and supply per person across countries.
Source: https://www.visualcapitalist.com/mapped-the-cost-of-water-across-u-s-states/
Related articles