Ranked: North America’s 12 Busiest Shipping Ports
The two busiest ports in North America share a single bay in southern California and dominate trade with Asia.
North America’s Biggest Shipping Ports, Ranked
Key Takeaways
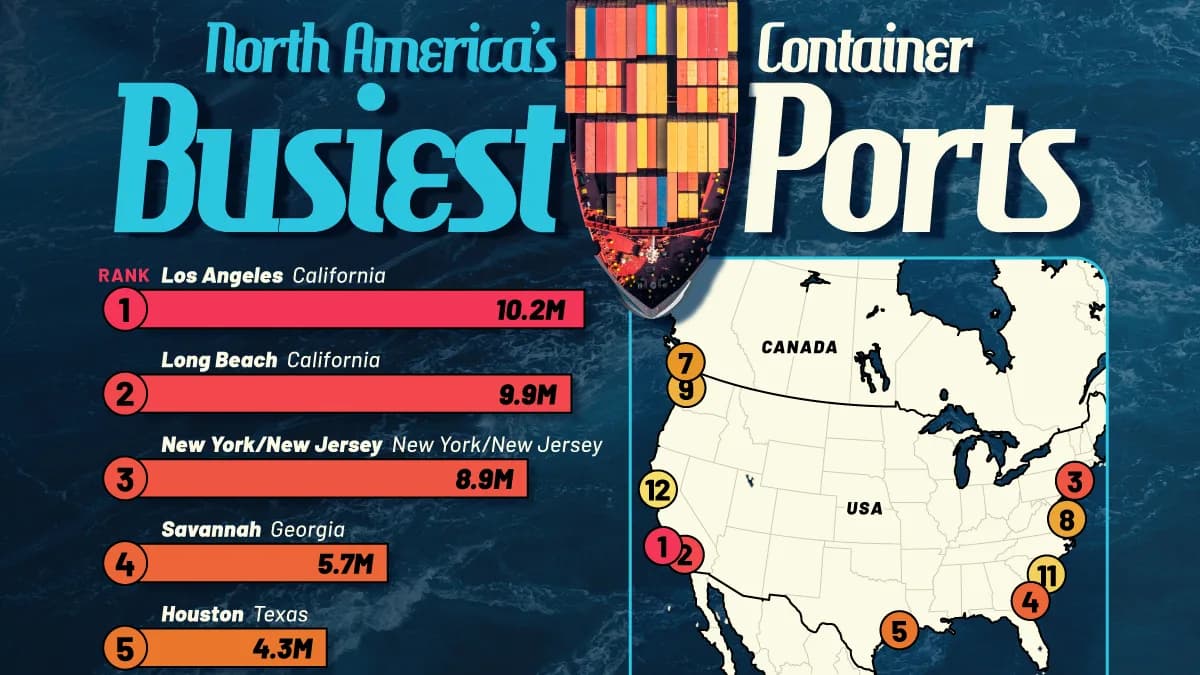
Los Angeles and Long Beach are North America’s two busiest container ports, handling a combined 20.1 million TEUs in 2025.
Houston (4.3 million TEUs) is the busiest container port on the Gulf Coast.
Manzanillo (3.9 million TEUs) and Vancouver (3.8 million TEUs) are the busiest container ports in Mexico and Canada, respectively.
Every year, millions of shipping containers arrive at North American ports carrying everything from electronics and furniture to clothing and machinery.
A handful of major gateways handle much of this traffic, with Southern California playing an especially important role in trade between Asia and North America.
This graphic ranks the busiest container ports in the U.S., Canada, and Mexico using 2025 figures from Lloyd’s List One Hundred Container Ports 2026. Totals include both loaded and empty containers.
Throughput is measured in twenty-foot equivalent units (TEUs), with a standard 20-foot container counting as one TEU and a 40-foot container counting as two.
The Twin Ports of Southern California
Together, Los Angeles and Long Beach handled more containers in 2025 than the next three busiest ports combined: New York/New Jersey, Savannah, and Houston.
This concentration of shipping activity makes Southern California one of the continent’s most important trade gateways, connecting trans-Pacific shipping routes with major U.S. consumer markets.
Meanwhile, the busiest container ports in Canada and Mexico are also on the Pacific Coast. These include Vancouver (3.8 million TEUs), Manzanillo (3.9 million TEUs), and Lázaro Cárdenas (2.6 million TEUs).
The table below shows North America’s busiest container ports by throughput in 2025.
RankPort2025 Throughput (TEUs)
1 Los Angeles10,239,318
2 Long Beach9,881,595
3 New York/New Jersey8,897,500
4 Savannah5,691,500
5 Houston4,303,300
6 Manzanillo3,893,357
7 Vancouver3,779,000
8 Virginia3,239,638
9 Seattle/Tacoma3,156,598
10 Lázaro Cárdenas2,616,770
11 Charleston2,565,297
12 Oakland2,253,976
New York/New Jersey (8.9 million TEUs) is the busiest container gateway on the East Coast, followed by Savannah (5.7 million TEUs). Houston (4.3 million TEUs) ranks fifth overall and leads the Gulf Coast.
The continent’s major ports saw differing trends in 2025. For example, the Port of Los Angeles’ volume slipped by 0.6%, while Long Beach grew by 2.4%, narrowing the gap between the neighboring ports.
The Asia Factor
Trade with Asia helps explain Southern California’s prominence. In 2025, Asian markets accounted for nearly 90% of the Port of Los Angeles’ cargo volume.
Many of the goods passing through its terminals are familiar consumer products, including furniture, apparel, and footwear. From the waterfront, these shipments move through distribution networks supplying retailers and households across the United States.
Moving those goods beyond the waterfront requires extensive inland infrastructure. The ports’ rail networks connect to the Alameda Corridor and the transcontinental rail system, allowing cargo arriving in Southern California to reach markets far beyond the West Coast.
Plugging the Infrastructure Gap
A port’s competitiveness depends partly on how efficiently goods reach their final destination. Shipping companies and importers must consider the onward journey by truck or train, not just the ocean crossing.
Savannah illustrates the importance of those inland connections. Beyond its nearly 5.7 million TEUs of annual throughput, the port handled more than half a million containers by rail, extending its reach beyond coastal Georgia.
Infrastructure investment is expanding that reach further. The Gainesville Inland Port opened in May 2026 as a rail-connected extension of Savannah serving northeast Georgia’s manufacturing and industrial businesses.
Such connections bring international shipping closer to inland factories and distribution centers, making the journey after unloading an important part of a port’s competitive position.
Learn More on the Voronoi App
To explore how trade policy shifts affect shipping activity, check out Charted: The Slump in U.S. Shipping Exports on Voronoi.
Related articles