Mapped: How Much People Spend on Food, by Country
Which countries spend the most on food? Explore global food spending patterns and how income disparities affect household budgets.
How Much Do People Around the World Spend on Food?
Key Takeaways:
Nigeria allocates the largest share of consumer spending to food at 56%, compared with just 6% in the United States and Singapore.
Myanmar (55%) and Laos (54%) round out the top three, while several wealthy countries spend less than 10%.
Countries where food accounts for a larger share of consumer spending may be more vulnerable to rising grocery prices.
How much of a household’s spending goes toward putting food on the table? Depending on where you live, the answer can range from a small fraction to more than half.
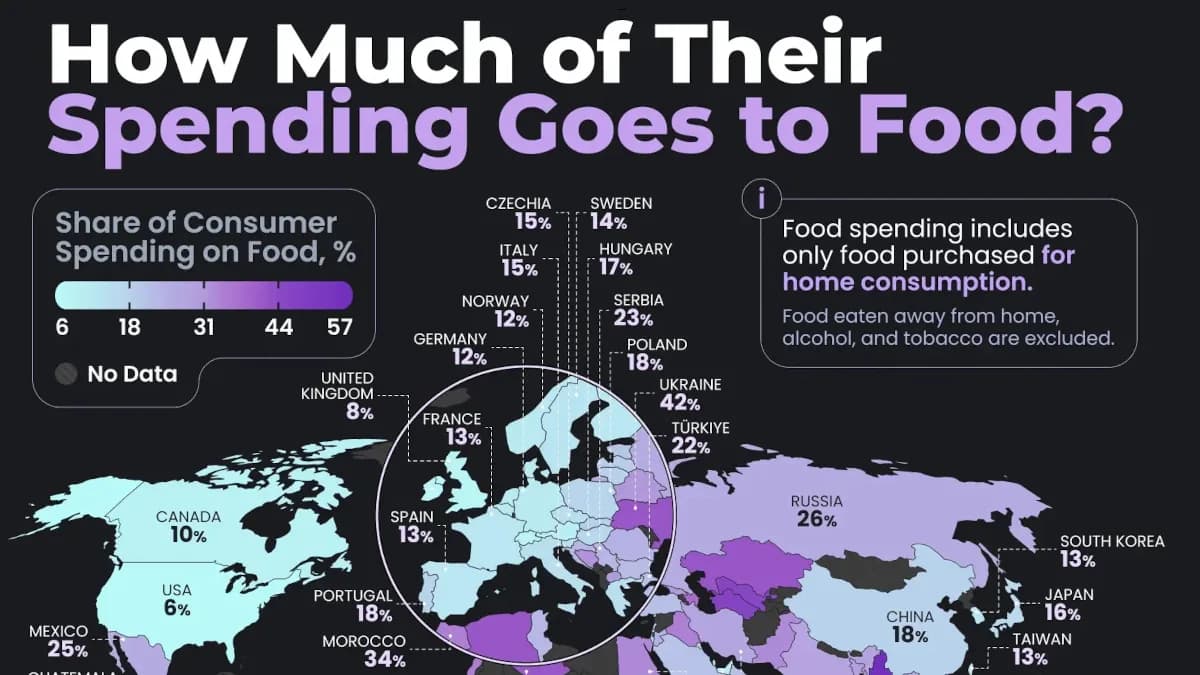
This visualization, created by Arciom Antanovič, uses 2025 data from the USDA’s Economic Research Service to compare food spending across 103 countries. It measures food purchased for consumption at home, excluding restaurants, alcohol, and tobacco.
Which Countries Spend the Most on Food?
The following table ranks countries by the share of consumer spending allocated to food, using the USDA’s International Food and Alcoholic Beverage Expenditure Data.
Country/TerritoryShare of Consumer Spending on Food, %
Nigeria56.2
Myanmar54.8
Laos53.9
Kenya48.7
Turkmenistan46.3
Tanzania45.8
Uzbekistan44.8
Côte d'Ivoire42.8
Cameroon42.8
Kazakhstan41.7
Ukraine41.6
Algeria41.5
Guatemala40.6
Ethiopia39.2
Ghana38.7
Angola38.2
Azerbaijan37.6
Philippines35.8
Uganda34.9
Morocco34.4
Iraq34.3
Cambodia34.0
Indonesia33.1
Egypt33.0
Pakistan32.8
Bosnia and Herzegovina31.9
Georgia31.0
Belarus30.6
Honduras30.3
North Macedonia29.8
Bangladesh29.6
Sri Lanka29.4
India28.1
Bolivia28.1
Paraguay27.7
Iran27.6
Argentina26.7
Vietnam26.4
El Salvador26.1
Russia25.7
Malaysia25.5
Mexico25.4
Jordan24.5
Thailand24.1
Romania23.9
Ecuador23.4
Serbia23.3
Peru23.1
Croatia22.9
Tunisia22.9
Bulgaria22.3
Colombia22.0
Turkey21.6
Oman21.4
Costa Rica21.4
Chile21.0
Saudi Arabia20.9
Dominican Republic20.7
Estonia20.4
Lebanon20.1
Latvia19.3
Slovakia19.0
Venezuela18.9
Uruguay18.8
Lithuania18.8
China18.1
Portugal18.0
Kuwait17.8
Poland17.8
Panama17.5
Hungary17.1
South Africa16.7
Japan16.3
Israel15.6
Italy14.9
Greece14.9
Czechia14.8
Slovenia14.2
Qatar14.1
Sweden13.7
Bahrain13.5
France13.3
Taiwan12.9
Finland12.9
Spain12.8
South Korea12.8
New Zealand12.6
Belgium12.5
Norway11.9
Denmark11.7
Brazil11.7
Netherlands11.6
Germany11.5
United Arab Emirates10.8
Austria9.9
Australia9.8
Canada9.5
Hong Kong8.5
Switzerland8.5
United Kingdom8.3
Ireland8.3
United States6.4
Singapore6.3
The gap between the highest- and lowest-spending countries is substantial. In Nigeria, more than half of consumer spending goes toward food purchased for home consumption, while other countries like the U.S. and Singapore spend closer to 6% each.
Why Food Spending Varies Across Regions
Income differences help explain these disparities. According to an economic principle known as Engel’s law, households generally devote a smaller share of their spending to food as incomes rise, even if the amount they spend on food increases.
This pattern is consistent with changes in global income levels over recent decades. However, regional differences remain striking. In Africa, Nigeria’s 56% contrasts with South Africa’s 17%. Across Asia, Myanmar’s 55% is nearly ten times Singapore’s 6%.
Importantly, these figures measure the share of consumer spending, not the absolute cost of groceries. Countries with lower percentages may still spend considerably more on food in dollar terms.
How Inflation and Food Insecurity Affect Affordability
Food inflation places additional pressure on households already spending substantial portions of their income on groceries. Rising prices for essential food commodities can force families to cut back on other necessities.
According to the World Food Programme, conflict, climate shocks, and economic pressures continue to drive food insecurity worldwide. The UN Food and Agriculture Organization also emphasizes that affordable, nutritious diets are essential for health and economic development.
A higher spending share does not necessarily indicate hunger. However, it can signal greater financial vulnerability when food prices rise faster than household incomes.
Learn More on the Voronoi App
To explore how rising prices could affect consumers worldwide, check out Where Food Inflation Will Hit Hardest in 2026 on the Voronoi app.
Related articles