Mapped: Where Data Centers Have Raised Power Prices the Most
Explore how data centers affected wholesale power prices, with modeled increases of 15.4% in WECC Northwest and 15.0% in Northern Virginia.
Published
October 27, 2026 10:06 am
By
The following content is sponsored by The National Public Utilities Council
Mapping the Impact of Data Centers on U.S. Power Prices
Key Takeaways
A study published by the Federal Reserve Bank of Dallas estimates data centers raised U.S. wholesale power prices by 6.9% by 2025.
WECC Northwest leads the 2024–2025 regional estimates at 15.4%, followed by Northern Virginia’s Dominion area at 15.0%.
These modeled wholesale effects do not represent equivalent increases in household electricity bills.
Data centers are changing electricity demand across the U.S., with consequences that reach beyond the communities hosting them. However, their impact on wholesale power prices varies sharply across the country.
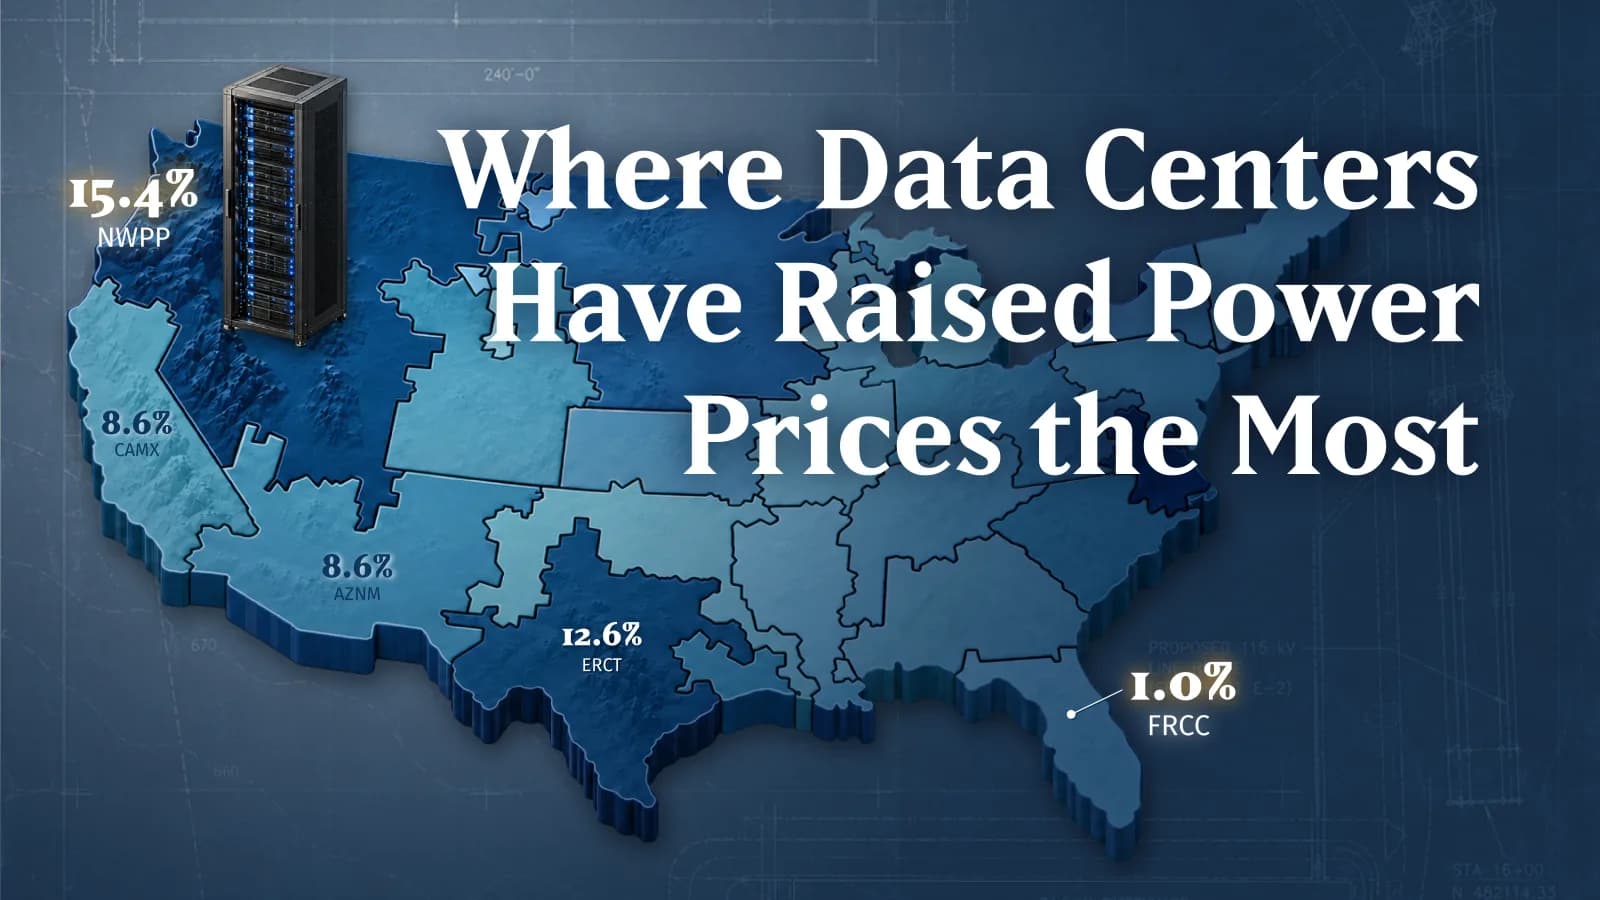
This graphic, in partnership with the National Public Utilities Council, shows data centers’ modeled wholesale-price impacts across 23 regions using data from the Federal Reserve Bank of Dallas.
Where Wholesale Prices Rose the Most
The WECC Northwest region leads with a modeled 15.4% increase during 2024–2025. Meanwhile, Northern Virginia’s Dominion area follows at 15.0%.
Here is a table that shows modeled wholesale-price impacts from data centers across 23 U.S. grid regions.
Region codeMain states/areas coveredModeled price increase
NWPPWashington, Oregon, Idaho, Utah; parts of Montana, Nevada, Wyoming, and northern California15.4%
SRVC-NParts of Virginia and northeastern North Carolina, approximating Dominion’s service area15.0%
ERCTTexas—most of the state12.6%
MROWIowa, Minnesota, Nebraska, North Dakota, South Dakota; parts of Wisconsin and eastern Montana12.1%
CAMXCalifornia—most of the state8.6%
AZNMArizona, New Mexico; parts of Nevada, California, and far western Texas8.6%
RMPAColorado, eastern Wyoming; parts of western Nebraska and western South Dakota7.7%
SRVC-SNorth Carolina and South Carolina—the remaining SRVC area outside SRVC-N7.5%
RFCWOhio, Indiana, West Virginia; parts of Illinois, Pennsylvania, Kentucky, Virginia, Maryland, and Wisconsin6.7%
SPNOKansas and western Missouri6.5%
SRTVTennessee, Kentucky; parts of Alabama, Mississippi, Georgia, Virginia, and North Carolina5.8%
NYUPNew York—upstate5.3%
NYCWNew York—New York City and the Westchester area5.2%
RFCENew Jersey, Delaware, Maryland, eastern Pennsylvania, and Washington, D.C.; parts of Virginia5.1%
SRMWMissouri and Illinois4.7%
NYLINew York—Long Island4.5%
SRSOAlabama, Georgia; parts of Mississippi and the Florida Panhandle4.2%
MROEParts of Wisconsin and Michigan’s Upper Peninsula4.0%
RFCMMichigan—primarily the Lower Peninsula3.8%
SPSOOklahoma; parts of Texas, New Mexico, Arkansas, and Louisiana3.1%
SRMVLouisiana, Arkansas; parts of Mississippi, Missouri, and eastern Texas3.0%
NEWEConnecticut, Maine, Massachusetts, New Hampshire, Rhode Island, and Vermont2.4%
FRCCFlorida—most of the state1.0%
Methodology
×
Methodology
Figures show modeled load-weighted average percentage increases in competitive wholesale electricity prices attributed to data-center demand during 2024–2025 under the Mid-Range (Peak) utilization scenario. SRVC-N and SRVC-S boundaries are approximate based on the study’s methodology.
ERCOT, covering most of Texas, ranks third at 12.6%, followed by MRO West at 12.1%. By contrast, Florida’s grid region records the smallest increase, at 1.0%.
Nationally, the study estimates that data centers raised wholesale power prices by 6.9% by 2025. The national figure therefore masks wide differences in regional price pressure.
How Price Pressure Crosses Regions
In addition, the effects do not stop at regional boundaries. Electricity trade can transmit price pressure to areas with limited local data-center growth.
WECC California, for example, shows an 8.6% increase. The broader takeaway: a region’s exposure extends beyond the data centers within its own borders.
What This Means for Utilities
These estimates use the Mid-Range (Peak) scenario and weight regional averages by electricity demand. However, they describe wholesale markets, not equivalent increases in household electricity bills.
The model compares electricity prices with data-center demand against prices without it. These estimates do not track price growth between 2024 and 2025.
Consequently, utilities need generation and grid capacity to keep pace as data center markets evolve. Planning must consider both local projects and demand across connected regions.
Related Topics: #united states #power grid #utilities #NPUC #data centers #power prices #electricity demand #Wholesale Electricity #Energy Infrastructure
You may also like
- Energy4 weeks ago Magic Radar 2026: How Do U.S. Utilities Compare on Decarbonization? How U.S. utilities compare on emissions intensity, net-zero target timing, and Scope 1, 2, and 3 reporting.
- Energy2 months ago The Rising Cost of Electricity in the United States Washington, DC had the largest increase in electricity prices from 2020 to 2025, while North Dakota saw the biggest decline.
- Technology3 months ago U.S. Battery Capacity Growth Forecast: 2026–2031 See how U.S. carbon offsets break down by project type in 2026, from forestry to methane, refrigerants, and wind.
- Energy4 months ago Ranked: Countries Building the Most Small Modular Nuclear Reactors Small Modular Nuclear Reactors are moving from concept to siting, with the U.S. leading at 28 announcements as power demand surges.
- Energy1 year ago Ranked: The Top 10 Cleanest Operating Utilities In The U.S. Just four U.S. utilities operate with over 80% carbon-free generation. This graphic ranks the top 10 cleanest utilities by their fuel mix.
Subscribe
Related articles