The $128 Trillion Global Economy: Every Country’s GDP Ranked
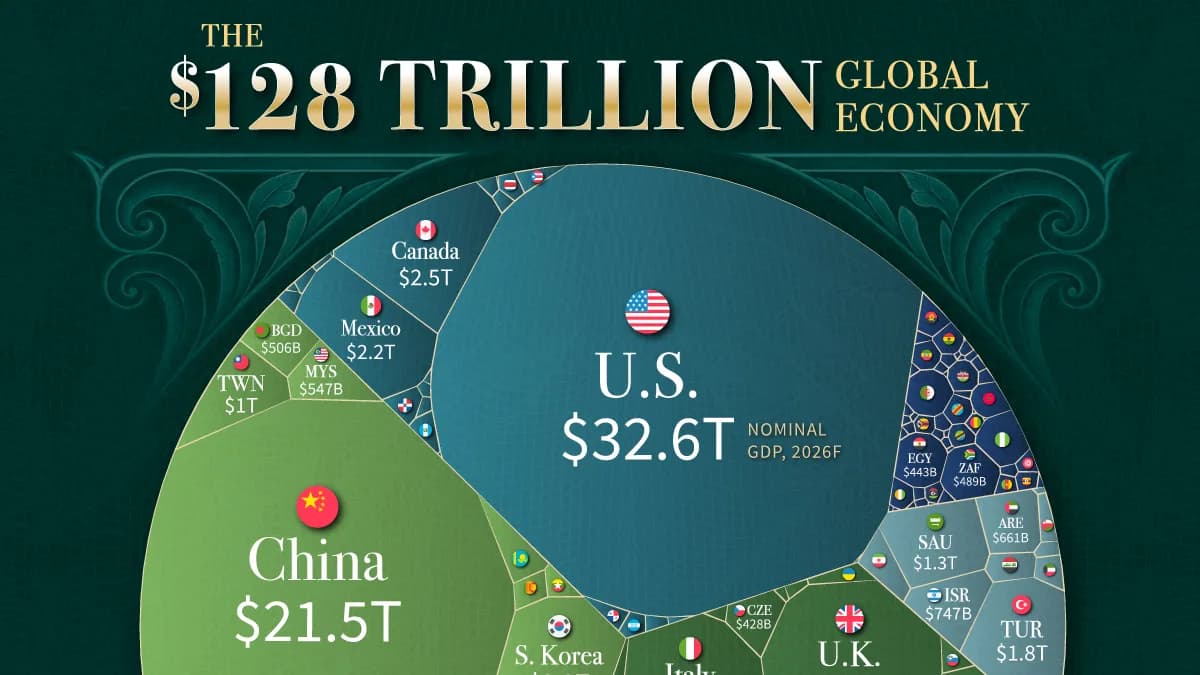
The global economy is projected to surpass $128 trillion in 2026. Nearly half of this comes from just two countries.
This story was prepared automatically by software.
How the World’s $128 Trillion Economy Breaks Down
Key Takeaways
The global economy is projected to surpass $128 trillion by the end of 2026, up roughly $20 trillion from 2023.
The United States ($32.64 trillion) and China ($21.55 trillion) together account for more than 42% of global economic output.
Just four countries, the U.S., China, Germany, and Japan, contribute approximately half of the world’s GDP.
The world’s economies vary enormously in size, from the United States at over $32 trillion to dozens of countries producing less than $100 billion annually.
This visualization breaks down nominal gross domestic product (GDP) by country and region using new forecasts from the IMF’s October 2026 World Economic Outlook. Figures measure annual economic output in current U.S. dollars, converted at market exchange rates.
The Two Economic Giants
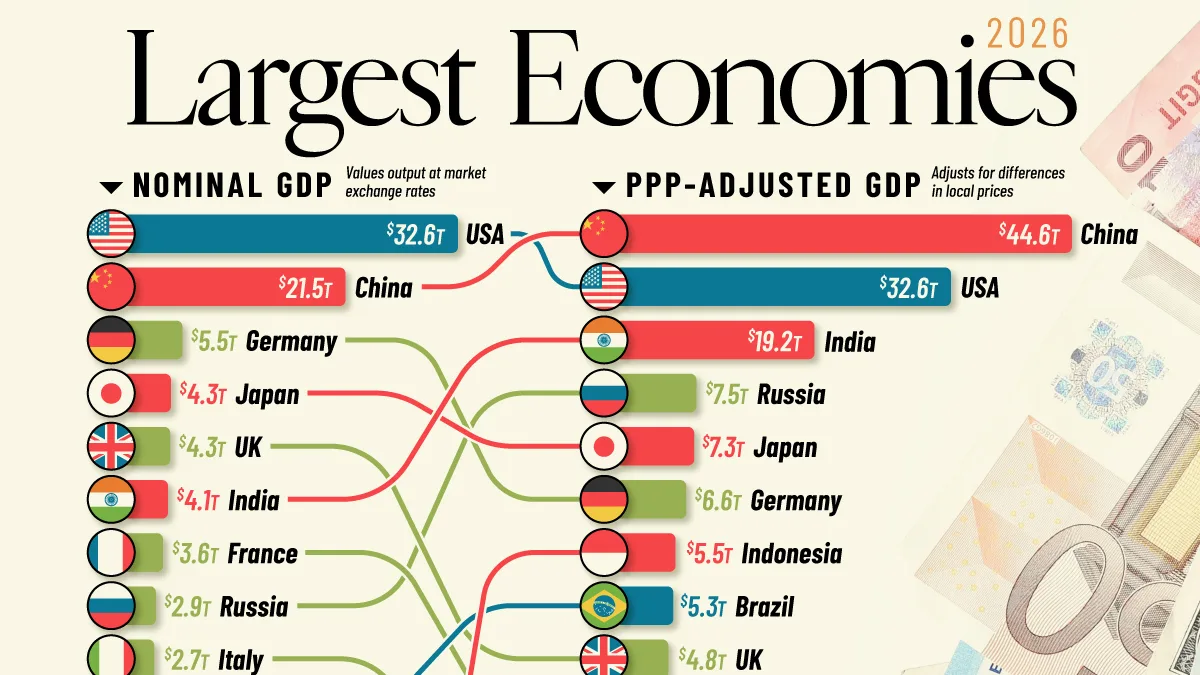
As the world’s largest economy, the U.S. leads with $32.64 trillion, accounting for approximately a quarter of global GDP. China follows at $21.55 trillion, more than four times the size of Germany’s economy, the world’s third-largest.
The gap between these two economic superpowers and the rest of the world is striking. The U.S. economy alone is larger than the combined output of Germany, Japan, the U.K., India, and France.
The following table ranks countries around the world by their nominal GDP in 2026.
RankCountryNominal GDP in 2026 (billions $)
1 U.S.32,642.37
2 China21,546.40
3 Germany5,471.30
4 Japan4,341.99
5 U.K.4,268.45
6 India4,060.21
7 France3,554.16
8 Russia2,861.16
9 Italy2,701.74
10 Brazil2,654.76
11 Canada2,490.26
12 South Korea2,245.85
13 Mexico2,176.24
14 Australia2,110.66
15 Spain2,085.28
16 Türkiye1,817.99
17 Indonesia1,479.95
18 Netherlands1,423.86
19 Saudi Arabia1,343.35
20 Switzerland1,135.74
21 Poland1,133.09
22 Taiwan1,019.60
23 Belgium772.70
24 Argentina768.21
25 Israel746.98
26 Sweden745.08
27 Ireland709.97
28 Singapore667.89
29 United Arab Emirates661.02
30 Norway651.71
31 Austria616.90
32 Thailand599.12
33 Colombia572.74
34 Malaysia547.10
35 Vietnam542.13
36 Bangladesh506.36
37 Philippines501.69
38 Denmark499.35
39 South Africa489.08
40 Romania470.09
41 Hong Kong455.16
42 Pakistan450.13
43 Egypt442.89
44 Czechia427.95
45 Chile402.24
46 Peru399.59
47 Kazakhstan397.92
48 Nigeria386.67
49 Portugal375.20
50 Finland338.56
51 Algeria331.89
52 Iran311.95
53 Greece304.63
54 New Zealand273.40
55 Hungary265.91
56 Iraq245.23
57 Ukraine229.41
58 Qatar203.04
59 Morocco195.63
60 Uzbekistan178.17
61 Slovakia167.06
62 Angola157.30
63 Kenya151.15
64 Kuwait146.91
65 Bulgaria146.51
66 Dominican Republic145.36
67 Ecuador138.20
68 Puerto Rico133.22
69 Guatemala132.27
70 Ghana128.64
71 Ethiopia127.15
72 Venezuela124.18
73 DR Congo122.28
74 Oman121.40
75 Croatia115.92
76 Costa Rica115.25
77 Serbia111.20
78 Sri Lanka110.68
79 Côte d'Ivoire110.45
80 Luxembourg108.33
81 Belarus108.11
82 Lithuania104.72
83 Panama96.47
84 Tanzania96.18
85 Uruguay95.16
86 Azerbaijan89.18
87 Slovenia88.87
88 Myanmar83.17
89 Turkmenistan83.00
90 Uganda72.24
91 Zimbabwe65.92
92 Jordan64.88
93 Cameroon64.81
94 Paraguay64.00
95 Tunisia62.74
96 Libya56.95
97 Macao54.66
98 Cambodia54.18
99 Bolivia53.84
100 Latvia53.16
101 Estonia51.03
102 Bahrain46.02
103 Nepal45.59
104 Guinea45.31
105 Cyprus44.29
106 Georgia44.11
107 Iceland42.77
108 Zambia42.38
109 Honduras40.97
110 Guyana40.34
111 Haiti39.39
112 El Salvador39.38
113 Bosnia and Herzegovina37.26
114 Papua New Guinea36.30
115 Mali34.91
116 Armenia32.97
117 Albania32.77
118 Burkina Faso32.41
119 Mongolia31.13
120 Sudan30.86
121 Malta30.51
122 Benin27.41
123 Trinidad and Tobago26.82
124 Kyrgyzstan26.69
125 Gabon25.99
126 Nicaragua25.40
127 Chad25.24
128 Mozambique24.77
129 Jamaica23.91
130 Niger23.37
131 Moldova22.22
132 Botswana22.13
133 North Macedonia21.24
134 Tajikistan21.11
135 Madagascar20.98
136 Republic of the Congo19.12
137 Brunei Darussalam18.87
138 Rwanda18.67
139 Laos18.39
140 Malawi18.31
141 Bahamas18.28
142 Namibia17.94
143 Mauritius16.94
144 Somalia14.82
145 Equatorial Guinea14.28
146 Mauritania14.26
147 Kosovo14.15
148 Togo13.14
149 Yemen10.98
150 Montenegro10.12
151 Liechtenstein9.59
152 Sierra Leone8.52
153 Barbados8.26
154 Maldives8.15
155 South Sudan7.98
156 Burundi7.61
157 Fiji6.57
158 Eswatini6.05
159 Suriname5.98
160 Liberia5.72
161 Central African Republic5.08
162 Andorra4.92
163 Djibouti4.87
164 Aruba4.68
165 Bhutan3.91
166 Belize3.44
167 Cabo Verde3.39
168 Lesotho3.10
169 Gambia3.02
170 Guinea-Bissau2.94
171 Saint Lucia2.76
172 San Marino2.43
173 Antigua and Barbuda2.39
174 Seychelles2.37
175 Timor-Leste2.17
176 Solomon Islands1.87
177 Comoros1.73
178 Grenada1.55
179 Vanuatu1.39
180 Samoa1.35
181 Saint Vincent and the Grenadines1.27
182 Saint Kitts and Nevis1.15
183 São Tomé and Príncipe1.12
184 Dominica0.79
185 Tonga0.73
186 Micronesia0.53
187 Kiribati0.40
188 Palau0.37
189 Marshall Islands0.34
190 Nauru0.20
191 Tuvalu0.08
World128,003.78
Beyond China and Japan, Asia is home to several other major economies. These include large consumer markets like India ($4.06 trillion) and Indonesia ($1.48 trillion), as well as manufacturing powerhouses like South Korea ($2.25 trillion).
Elsewhere, Brazil ($2.65 trillion) accounts for roughly half of South America’s economy, while Australia ($2.11 trillion) contributes most of Oceania’s total output.
AI Investment Adds Momentum
Beyond their current size, the world’s largest economies are being shaped by different growth drivers. In the U.S., the AI investment boom is generating demand for servers, software, data centers, and power infrastructure. Training and running advanced models requires enormous computing capacity, creating business opportunities for companies supplying and building that infrastructure.
Consumer spending provides another source of growth. The U.S. economy expanded at an inflation-adjusted annualized rate of 2.2% in the second quarter of 2026, with household spending, investment, and exports all contributing to growth.
AI investment also creates opportunities overseas. Growing trade in computers, servers, and semiconductors connects American investment with suppliers across Asia. For economies producing these components, demand from the world’s largest economy can support exports and new production facilities.
China’s Tech Advantage
China’s economy grew 4.6% year over year in the first nine months of 2026, with advanced manufacturing providing a particularly strong source of expansion. High-tech manufacturing output rose 14.3%, alongside rapid increases in the production of industrial robots and lithium-ion batteries.
Overseas demand also supported Chinese producers. The country’s trade surplus in goods is on track to surpass $1 trillion again, supported by strong exports of semiconductors and green technologies. These industries connect China’s manufacturing base with customers and businesses around the world.
Meanwhile, the property downturn continues to weigh on the domestic economy. Real estate development investment fell by more than 20% during the first three quarters of 2026, while retail sales remained sluggish. Technology and export-oriented industries are consequently providing important support as the country works through weakness in housing and consumer demand.
Learn More on the Voronoi App
To explore how Asia’s share of global GDP is changing, check out Emerging Asia Accounts for 60% of Global Economic Growth on Voronoi.
Related articles