Mapped: Credit Scores Across All 50 U.S. States
Credit scores shape Americans' abilities to get everything from credit cards to mortgages. This is bad news for Southerners.
This story was prepared automatically by software.
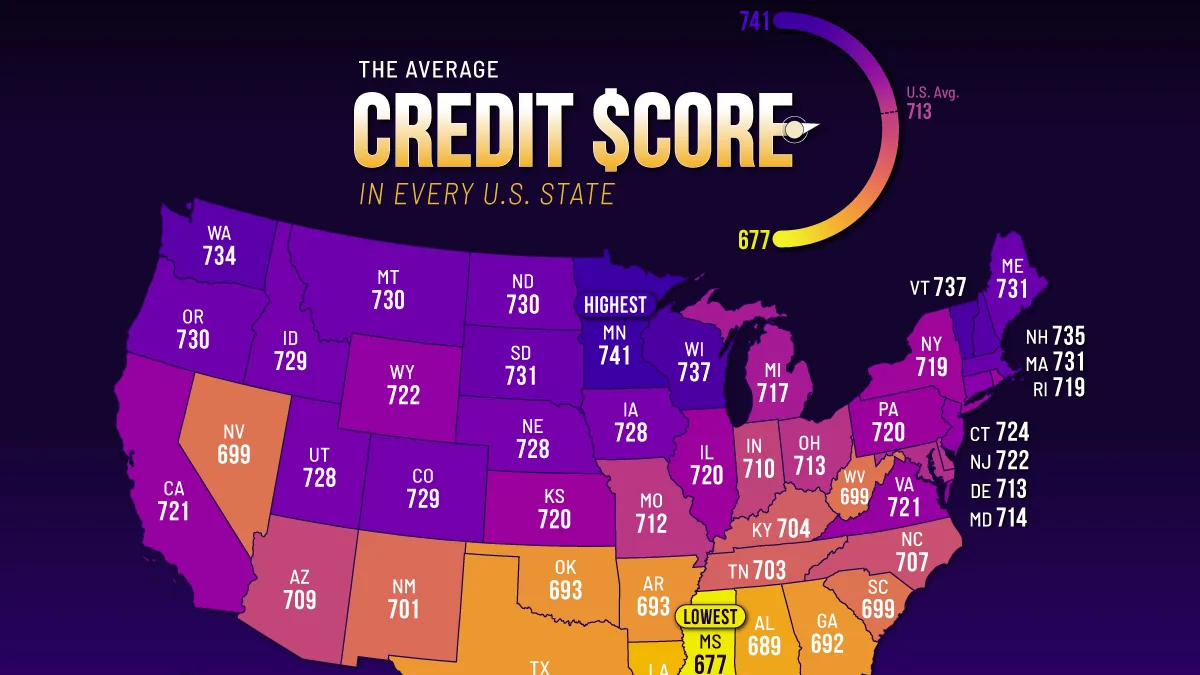
How Credit Scores Compare Across America
Key Takeaways
Minnesota has the highest average credit score in the U.S. at 741, followed by Vermont and Wisconsin at 737.
Mississippi ranks last at 677, creating a 64-point gap between the highest- and lowest-scoring states.
The national average fell to 713 in 2025, marking its first annual decline since 2013.
A strong credit score can mean lower interest rates on mortgages, car loans, and credit cards, making it an important measure of Americans’ financial health.
But how does your state compare with the rest of the country?
This map shows average credit scores across all 50 states using Experian’s September 2025 data. Scores are based on FICO Score 8, which ranges from 300 to 850.
America’s North–South Credit Divide
The Upper Midwest and New England dominate the top of the rankings, with Minnesota, Wisconsin, Vermont, and New Hampshire all averaging 735 or higher.
At the other end, several Southern states fall below 700, including Mississippi, Alabama, Georgia, and South Carolina. The pattern highlights a clear geographic divide in average credit scores across the country.
The contrast extends to America’s largest state economies. Texas averages 692, well below California’s 721, while Florida’s 704 also falls short of the national average of 713.
The following table ranks U.S. states by their average credit scores as of September 2025.
StateAverage FICO score (2025)
Minnesota741
Vermont737
Wisconsin737
New Hampshire735
Washington734
Massachusetts731
Maine731
South Dakota731
Hawaii730
Montana730
North Dakota730
Oregon730
Colorado729
Idaho729
Iowa728
Nebraska728
Utah728
Connecticut724
New Jersey722
Wyoming722
California721
Virginia721
Alaska720
Illinois720
Kansas720
Pennsylvania720
New York719
Rhode Island719
Michigan717
Maryland714
Delaware713
Ohio713
Missouri712
DC711
Indiana710
Arizona709
North Carolina707
Florida704
Kentucky704
Tennessee703
New Mexico701
Nevada699
South Carolina699
West Virginia699
Arkansas693
Oklahoma693
Georgia692
Texas692
Alabama689
Louisiana686
Mississippi677
U.S. Average713
Nationally, the average slipped from 715 in 2024 to 713 in 2025, marking a notable reversal after more than a decade of improving or stable scores.
Household budgets are also facing higher debt payments. Average monthly debt obligations reached $1,256 in 2025, up 2.6%, even as average total debt balances increased just 0.4%. Borrowers are paying more each month without taking on substantially larger balances.
Student Loan Delinquencies Hit Credit Records
One major change in 2025 was the return of negative reporting on federal student loans. After nearly five years of pandemic-era protections, missed payments began appearing on credit reports again, exposing struggling borrowers to sharp declines in their credit scores.
More than 2 million student loan borrowers who became newly delinquent in the first quarter experienced credit score drops exceeding 100 points. For borrowers who previously qualified for affordable financing, such declines could substantially narrow their options.
The highest rates of overdue student loans were concentrated in the South, mirroring the broader geographic pattern. The consequences extend beyond education debt, as damaged credit can make a future car loan or mortgage more expensive or harder to obtain.
How Better Credit Can Save Thousands
For homebuyers, the lowest mortgage rates generally go to borrowers with credit scores in the mid-to-high 700s or above. Stronger credit can provide a meaningful financial advantage when buying a home.
Even a one-percentage-point difference in mortgage rates can translate into substantial costs. On a $300,000, 30-year fixed mortgage, a 7% rate rather than 6% adds approximately $197 to the monthly principal and interest payment.
Over 30 years, that’s roughly $71,000 in additional interest, illustrating why stronger credit can have a lasting financial payoff.
Payment history has the biggest influence on FICO scores, typically accounting for 35% of the calculation. Amounts owed contribute another 30%, including how much available credit a borrower uses. Consistent on-time payments and manageable credit card balances can help build stronger credit profiles.
Learn More on the Voronoi App
To see how another form of borrowing could affect credit scores, check out BNPL loans will now count toward Americans’ credit scores on Voronoi.
Related articles