
Quality of Life vs. Cost in 99 Cities Across the Americas
Which cities offer the best quality of life for the cost? Explore how 99 cities across the Americas compare on affordability and livability.
This story was prepared automatically by software.
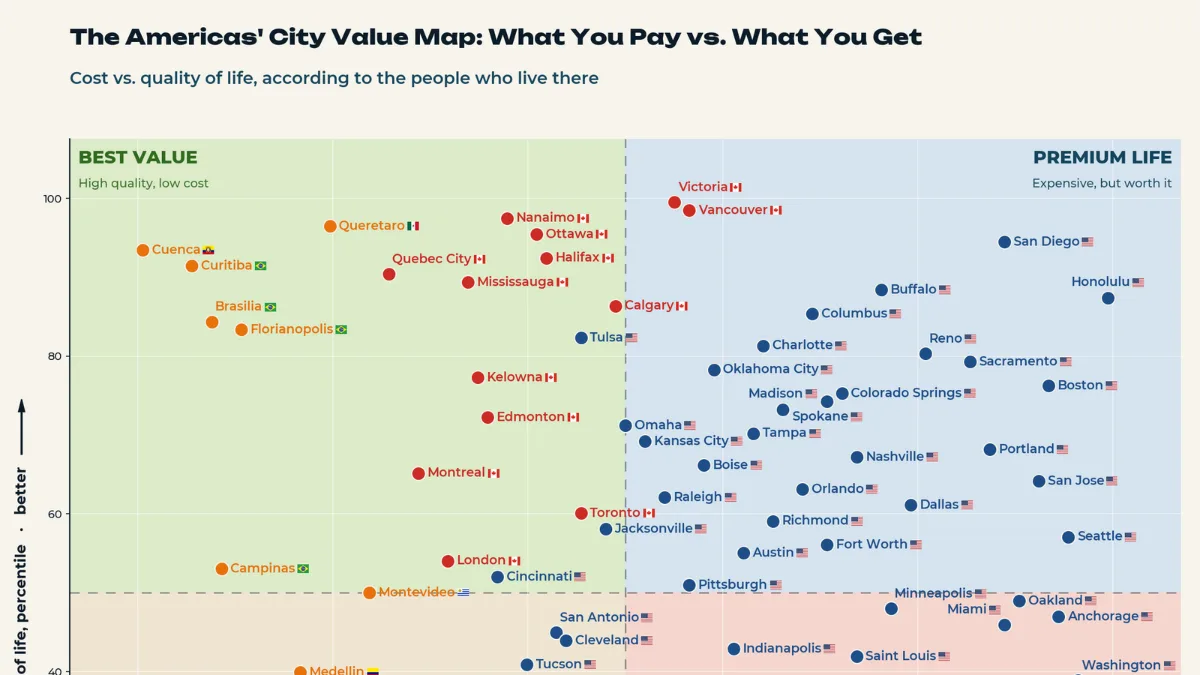
Where Does Quality of Life Go Furthest for the Cost?
Key Takeaways:
Victoria, Canada, ranks in the 99th percentile for quality of life among 99 cities across the Americas, with living costs in the 55th percentile.
Cuenca, Ecuador, combines a 93rd-percentile quality-of-life ranking with living costs in the bottom 1% of cities surveyed.
Higher living costs don’t necessarily translate into better quality of life, with cities appearing in all four quadrants of the chart.
Where can residents enjoy a high quality of life without paying a premium?
This visualization, created by Valerii Emelianov, compares 99 cities across North and South America using Numbeo’s Quality of Life Index and cost-of-living data from August 2026.
Both axes show percentile rankings within the sample. The quality-of-life measure excludes price-linked components to avoid counting affordability twice.
Which Cities Offer the Best Value?
The chart’s upper-left quadrant highlights cities that combine above-median quality of life with below-median living costs. The following table provides the underlying city-level rankings and index scores.
Numbeo’s quality-of-life measures incorporate factors such as safety, healthcare, pollution, traffic, and climate. However, its crowdsourced data reflects contributors’ experiences rather than a representative survey of all residents.
CityCost of Living Percentile Livability Percentile Cost of Living Index Quality of Life Index
Cuenca0.593.430.5153.8
Curitiba5.691.435.8145.8
Brasilia7.684.336.7150.6
Florianopolis10.683.337.7150.0
Queretaro (Santiago de Querétaro)19.796.549.8156.4
Campinas8.653.036.8133.9
Nanaimo, BC37.997.565.4191.4
Victoria55.199.569.8190.5
Quebec City25.890.460.0191.0
Belo Horizonte2.531.834.8125.1
Vancouver56.698.570.0182.9
Porto Alegre3.526.835.3121.2
Ottawa40.995.565.8191.9
Mississauga33.889.464.4172.6
Halifax41.992.466.2176.1
Kelowna34.977.364.6173.4
Medellin16.739.948.5115.8
Quito4.616.735.4122.1
Calgary49.086.467.6180.2
Montreal28.865.260.3170.9
Edmonton35.972.264.7188.3
Tulsa, OK45.582.367.0186.7
Montevideo23.750.058.2139.6
Guadalajara15.728.846.7118.3
Omaha, NE50.071.268.0185.0
London31.854.063.9168.0
Oklahoma City, OK59.178.370.4186.3
Recife1.56.632.688.6
Kansas City, MO52.069.268.8185.4
Cincinnati, OH36.952.065.1185.7
Charlotte, NC64.181.372.4186.6
Toronto45.560.167.0168.3
Jacksonville, FL48.058.167.4186.2
Columbus, OH69.285.473.8184.0
Boise, ID58.166.270.2186.2
Tampa, FL63.170.272.0186.2
Raleigh, NC54.062.169.7185.6
Panama City17.719.748.6117.9
Buffalo, NY76.388.476.1183.1
Buenos Aires22.724.853.4119.4
Madison, WI66.273.273.1183.7
Brampton27.335.960.1158.2
Santiago14.110.643.7111.2
Lima6.60.536.590.2
San Antonio, TX42.945.066.5182.8
Monterrey21.723.752.9119.6
Tucson, AZ39.940.965.7186.2
Rio de Janeiro9.61.537.181.6
Cleveland, OH43.943.966.8176.2
Bogota14.18.643.7104.0
Spokane, WA70.774.274.1186.4
Pittsburgh, PA56.651.070.0186.3
Colorado Springs, CO72.275.374.4185.2
Sao Paulo11.64.641.399.0
Austin, TX62.155.171.7186.6
San Diego, CA88.994.485.9181.9
Orlando, FL68.263.173.4186.2
Albuquerque, NM32.832.864.1178.7
Reno, NV80.880.377.2183.2
Richmond, VA65.259.172.8185.1
Santo Domingo12.62.541.888.9
Nashville, TN73.767.275.2181.8
Milwaukee, WI51.037.968.1172.4
Indianapolis, IN61.142.971.0185.4
Sacramento, CA85.479.380.6183.1
Salt Lake City, UT47.033.867.2175.5
San Jose24.821.759.9120.4
Fort Worth, TX70.756.174.1183.7
Winnipeg29.818.761.1150.2
Dallas, TX79.361.177.0180.7
Honolulu, HI99.587.4108.4159.4
Hamilton27.313.660.1153.9
Caracas18.73.549.777.7
Boston, MA93.476.390.7177.0
Houston, TX38.922.765.6172.7
Mexico City20.75.651.596.5
Regina30.814.763.7151.3
Portland, OR87.468.285.5176.8
Minneapolis, MN77.348.076.2178.1
Saint Louis, MO73.741.975.2181.3
San Jose, CA92.464.189.4183.7
Seattle, WA95.557.192.8184.2
Oakland, CA90.449.086.4172.2
San Juan60.120.770.9140.0
Miami, FL88.946.085.9159.0
Anchorage, AK94.447.090.8173.0
Denver, CO82.336.978.8166.7
Baltimore, MD75.325.875.6172.8
Atlanta, GA84.334.980.3179.7
Las Vegas, NV67.215.773.2155.9
New Orleans, LA83.330.879.0163.4
Washington, DC96.538.993.7178.4
Detroit, MI53.07.669.4139.1
Philadelphia, PA86.427.880.8166.8
Phoenix, AZ78.312.676.6156.7
San Francisco, CA97.529.896.3171.5
Chicago, IL80.811.677.2157.4
New York, NY98.517.7100.0136.2
Los Angeles, CA91.49.687.6134.4
Cuenca and Querétaro stand out for combining relatively low costs with high livability. Canadian cities including Nanaimo, Ottawa, and Halifax also perform strongly, while New York, Los Angeles, and Chicago fall into the high-cost, low-livability quadrant.
Among U.S. cities, San Diego is a notable exception, ranking in the 94th percentile for quality of life despite its 89th-percentile living costs.
How Do the U.S. and Canada Compare?
Canada’s strongest cities cluster near the top of the quality-of-life rankings, while U.S. cities show greater variation. The two countries have long maintained close economic ties, but their quality-of-life metrics differ in several areas.
According to Numbeo’s country comparison, the U.S. scores higher on purchasing power (166.3 versus 134.5), while Canada performs better on safety (54.5 versus 50.8) and healthcare (68.6 versus 66.8).
Canada’s publicly funded healthcare system and stronger statutory parental leave benefits can also reduce certain household financial risks, although housing affordability remains a challenge in major Canadian cities.
Does Higher Spending Mean Better Living?
Not necessarily. Los Angeles ranks in the 91st percentile for living costs but only the 10th percentile for quality of life. San Jose also ranks above the 90th percentile for costs without reaching the 70th percentile for livability.
One reason for this disconnect is that expensive cities often face challenges that higher incomes cannot fully offset. Long commutes, pollution, and safety concerns can affect everyday life, even in cities with strong job markets and high salaries.
Conversely, smaller cities with lower housing costs and less congestion may offer a more comfortable lifestyle at a lower price. However, affordability also depends on local wages and purchasing power, meaning lower living costs don’t automatically translate into better financial outcomes for residents.
Ultimately, the comparison shows why finding cities at the intersection of affordability and high quality of life requires looking beyond prices alone.
Learn More on the Voronoi App
Explore Mapped: Where People Think Quality of Life Is Best to see how cities across the Americas compare.
Source: https://www.visualcapitalist.com/cp/quality-of-life-vs-cost-in-99-cities-across-the-americas/