Mapped: Political Ad Spending by U.S. State in 2026
Explore political ad spending by state ahead of the 2026 midterms, including Democratic, Republican, and unclassified spending.
Where Is Political Ad Money Going in 2026?
Key Takeaways
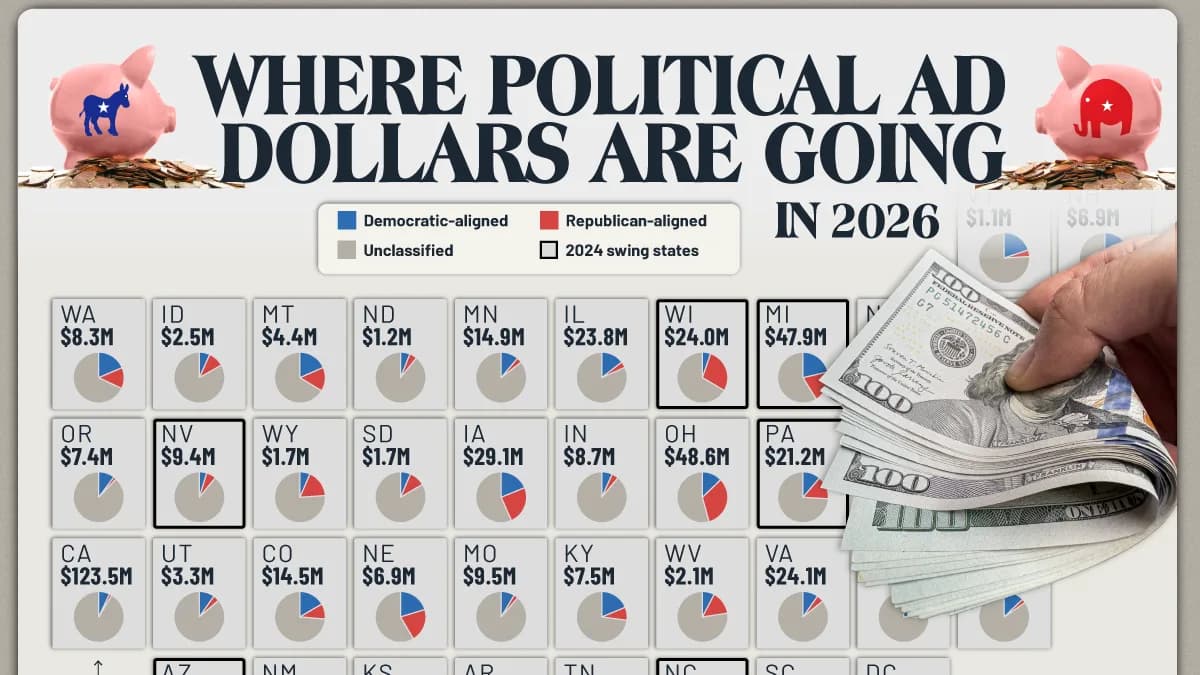
California, Texas, Ohio, Michigan, and Florida account for more than 40% of tracked political and issue advertising spending across the 50 states.
Spending patterns vary considerably by state, with some showing relatively balanced Democratic- and Republican-aligned activity while others lean heavily toward one party.
About 71% of tracked spending on Meta and Google comes from advertisers that cannot be reliably linked to either major party.
As the 2026 U.S. midterm elections approach, political campaigns and advocacy groups are spending millions to reach Americans through digital advertising.
This visualization maps political and issue advertising spending on Meta and Google across all 50 states and Washington, D.C., revealing where spending is concentrated and how it breaks down by political affiliation.
The data comes from ScrapeLads, which analyzed spending reported through Meta’s Ad Library and Google’s Political Ads Transparency Report.
Which States Are Seeing the Most Political Ad Spending?
California leads with $123.5 million in tracked spending, followed by Texas at $79.4 million. Together, the two states account for roughly 25% of spending across the 50 states.
The table below ranks states by their total political and issue advertising spending on Meta and Google.
RankStateTotal spending
1California$123,520,385
2Texas$79,428,870
3Ohio$48,598,910
4Michigan$47,902,754
5Florida$42,478,068
6Georgia$36,810,172
7Iowa$29,093,348
8New York$27,200,205
9North Carolina$25,525,700
10Arizona$24,087,528
11Virginia$24,082,561
12Wisconsin$23,971,263
13Illinois$23,814,543
14Pennsylvania$21,227,541
15Maine$15,487,532
16Alaska$15,159,912
17Minnesota$14,884,198
18Colorado$14,499,220
19South Carolina$13,290,935
20Massachusetts$10,857,514
21New Jersey$10,055,777
22Kansas$9,651,503
23Missouri$9,545,487
24Nevada$9,365,603
25Tennessee$9,249,948
26Indiana$8,666,981
27Washington$8,345,713
28Alabama$8,321,175
29Kentucky$7,511,030
30Oregon$7,360,622
31Maryland$7,193,095
32Oklahoma$7,166,115
33New Hampshire$6,929,945
34Nebraska$6,883,958
35Connecticut$6,312,343
36Louisiana$4,956,539
37Montana$4,390,095
38New Mexico$3,761,900
39Utah$3,311,158
40Arkansas$3,100,937
41Mississippi$2,828,274
42District of Columbia$2,623,277
43Idaho$2,510,083
44West Virginia$2,138,921
45Rhode Island$1,926,657
46Hawaii$1,767,880
47Wyoming$1,704,012
48South Dakota$1,703,702
49Delaware$1,652,094
50North Dakota$1,225,230
51Vermont$1,104,000
Ohio ($48.6 million) and Michigan ($47.9 million) follow, while Florida ($42.5 million) and Georgia ($36.8 million) also rank among the largest advertising markets.
However, total spending tells only part of the story. Most of California’s advertising spending is unclassified, while Texas has substantial spending linked to both Democratic- and Republican-aligned advertisers.
Why Is 71% of Political Ad Spending Unclassified?
More than seven out of every 10 dollars in tracked political and issue advertising spending cannot be confidently assigned to either major party.
This does not mean the advertisers are anonymous or that the money is hidden. Instead, the dataset includes many organizations that do not have a verified Democratic or Republican affiliation.
The table below shows how much unclassified advertising spending was recorded in each state.
RankStateUnclassified ad spending
1California$112,880,318
2Texas$46,317,454
3Florida$32,763,236
4Georgia$31,666,032
5Michigan$28,178,516
6Ohio$26,361,801
7Virginia$20,655,789
8Illinois$19,454,696
9New York$19,119,692
10Iowa$16,472,334
11Wisconsin$15,945,537
12Pennsylvania$15,714,594
13North Carolina$13,149,786
14Arizona$12,941,886
15Minnesota$12,729,245
16Colorado$10,683,789
17Missouri$8,464,152
18Nevada$8,338,486
19South Carolina$7,933,888
20Indiana$7,710,378
21Tennessee$7,587,916
22Massachusetts$7,312,806
23New Jersey$7,303,375
24Alabama$7,124,927
25Oregon$6,470,070
26Oklahoma$6,132,094
27Alaska$5,966,809
28Washington$5,673,897
29Maine$5,596,076
30Kentucky$5,471,868
31Connecticut$5,453,286
32Maryland$5,380,131
33Kansas$4,712,823
34Nebraska$4,021,006
35Louisiana$3,731,908
36New Hampshire$2,925,526
37Montana$2,910,565
38New Mexico$2,873,636
39Utah$2,858,004
40Arkansas$2,483,243
41Mississippi$2,325,868
42District of Columbia$2,140,651
43Idaho$2,088,966
44West Virginia$1,653,688
45Rhode Island$1,597,556
46Hawaii$1,512,026
47South Dakota$1,421,528
48Delaware$1,397,896
49Wyoming$1,297,057
50North Dakota$1,092,840
51Vermont$838,766
California stands out with $112.9 million in unclassified spending, more than twice Texas’s $46.3 million. Georgia also has a high proportion of unclassified spending, accounting for roughly 86% of its $36.8 million total.
To classify advertisers, ScrapeLads matched their names against Federal Election Commission records, using candidate affiliations, party committees, and independent expenditures. For the independent expenditure category, advertisers needed at least $25,000 in expenditures, with 85% or more supporting one party’s candidates or opposing the other’s.
The unclassified category includes companies, issue advocacy groups, ballot measure campaigns, and some state and local candidates. Some of these advertisers may support candidates or political causes without meeting the study’s criteria for a Democratic or Republican classification.
Where Are Democratic and Republican Advertisers Spending?
Looking specifically at advertisers with identified party affiliations reveals a different picture from the overall spending totals.
Texas has the highest identified spending for both parties, with approximately $15.8 million from Democratic-aligned advertisers and $17.3 million from Republican-aligned advertisers.
The table below compares Democratic- and Republican-aligned advertising spending by state.
StateDemocratic-alignedRepublican-aligned
Alabama$399,884$796,364
Alaska$5,795,801$3,397,302
Arizona$7,036,241$4,109,401
Arkansas$337,249$280,445
California$8,670,697$1,969,370
Colorado$2,394,628$1,420,803
Connecticut$745,092$113,965
Delaware$211,855$42,343
District of Columbia$412,819$69,807
Florida$4,377,842$5,336,990
Georgia$3,611,512$1,532,628
Hawaii$215,065$40,789
Idaho$169,067$252,050
Illinois$3,448,437$911,410
Indiana$582,692$373,911
Iowa$5,473,042$7,147,972
Kansas$4,403,889$534,791
Kentucky$1,411,945$627,217
Louisiana$374,592$850,039
Maine$4,949,923$4,941,533
Maryland$1,641,964$171,000
Massachusetts$3,058,018$486,690
Michigan$10,237,653$9,486,585
Minnesota$1,657,449$497,504
Mississippi$327,699$174,707
Missouri$820,494$260,841
Montana$809,589$669,941
Nebraska$1,398,115$1,464,837
Nevada$440,506$586,611
New Hampshire$2,450,608$1,553,811
New Jersey$2,057,944$694,458
New Mexico$422,714$465,550
New York$6,180,682$1,899,831
North Carolina$6,076,709$6,299,205
North Dakota$73,470$58,920
Ohio$6,249,485$15,987,624
Oklahoma$246,678$787,343
Oregon$753,380$137,172
Pennsylvania$2,390,563$3,122,384
Rhode Island$275,932$53,169
South Carolina$3,329,951$2,027,096
South Dakota$109,573$172,601
Tennessee$814,328$847,704
Texas$15,776,036$17,335,380
Utah$323,195$129,959
Vermont$219,091$46,143
Virginia$2,346,868$1,079,904
Washington$1,548,335$1,123,481
West Virginia$164,465$320,768
Wisconsin$1,251,307$6,774,419
Wyoming$110,274$296,681
Ohio shows a more pronounced difference. Republican-aligned advertisers spent approximately $16.0 million, more than double the $6.2 million recorded for Democratic-aligned advertisers.
Other states show different patterns. Michigan’s identified spending is relatively balanced, at $10.2 million Democratic-aligned and $9.5 million Republican-aligned. Wisconsin, meanwhile, has $6.8 million in identified Republican-aligned spending compared with $1.3 million Democratic-aligned.
These figures do not necessarily represent all advertising supporting either party, because some politically aligned organizations remain unclassified.
What Do the Numbers Reveal About the Midterms?
Several states that were closely contested in the 2024 presidential election are seeing substantial digital advertising spending ahead of the 2026 midterms.
Among these states, Michigan leads with $47.9 million in tracked spending, followed by Georgia ($36.8 million), North Carolina ($25.5 million), Arizona ($24.1 million), and Wisconsin ($24.0 million).
Pennsylvania has $21.2 million, while Nevada has $9.4 million.
These totals include advertising by candidate campaigns, political organizations, and groups promoting specific issues or ballot measures. An advertisement about immigration, health care, or energy policy, for example, may contribute to the political debate without explicitly endorsing a candidate.
As a result, these figures reflect the broader political advertising landscape, not just ads directly supporting or opposing candidates in the midterms.
Advertising spending is only one part of the midterm election picture. Voter participation also varies considerably across age groups, as shown in our visualization of midterm voter turnout by age.
How Much Political Advertising Does the Data Capture?
The dataset covers political and issue advertising on Meta and Google, rather than all campaign spending.
Meta’s data covers July 20 through October 17, 2026. Google’s state-level data covers January 1 through October 17, 2026, but represents approximately 63% of Google’s reported spending during that period.
The dataset therefore excludes some advertising outside these reporting windows, as well as political advertising on other platforms and traditional media such as television and radio.
Explore Political Ad Spending in Every State
The complete table below includes total spending and the breakdown by Democratic-aligned, Republican-aligned, and unclassified advertisers for all 50 states and Washington, D.C.
Use the table to compare states and see how the composition of political advertising spending varies across the country.
StateTotal spendingDemocratic-alignedRepublican-alignedUnclassified
California$123,520,385$8,670,697$1,969,370$112,880,318
Texas$79,428,870$15,776,036$17,335,380$46,317,454
Ohio$48,598,910$6,249,485$15,987,624$26,361,801
Michigan$47,902,754$10,237,653$9,486,585$28,178,516
Florida$42,478,068$4,377,842$5,336,990$32,763,236
Georgia$36,810,172$3,611,512$1,532,628$31,666,032
Iowa$29,093,348$5,473,042$7,147,972$16,472,334
New York$27,200,205$6,180,682$1,899,831$19,119,692
North Carolina$25,525,700$6,076,709$6,299,205$13,149,786
Arizona$24,087,528$7,036,241$4,109,401$12,941,886
Virginia$24,082,561$2,346,868$1,079,904$20,655,789
Wisconsin$23,971,263$1,251,307$6,774,419$15,945,537
Illinois$23,814,543$3,448,437$911,410$19,454,696
Pennsylvania$21,227,541$2,390,563$3,122,384$15,714,594
Maine$15,487,532$4,949,923$4,941,533$5,596,076
Alaska$15,159,912$5,795,801$3,397,302$5,966,809
Minnesota$14,884,198$1,657,449$497,504$12,729,245
Colorado$14,499,220$2,394,628$1,420,803$10,683,789
South Carolina$13,290,935$3,329,951$2,027,096$7,933,888
Massachusetts$10,857,514$3,058,018$486,690$7,312,806
New Jersey$10,055,777$2,057,944$694,458$7,303,375
Kansas$9,651,503$4,403,889$534,791$4,712,823
Missouri$9,545,487$820,494$260,841$8,464,152
Nevada$9,365,603$440,506$586,611$8,338,486
Tennessee$9,249,948$814,328$847,704$7,587,916
Indiana$8,666,981$582,692$373,911$7,710,378
Washington$8,345,713$1,548,335$1,123,481$5,673,897
Alabama$8,321,175$399,884$796,364$7,124,927
Kentucky$7,511,030$1,411,945$627,217$5,471,868
Oregon$7,360,622$753,380$137,172$6,470,070
Maryland$7,193,095$1,641,964$171,000$5,380,131
Oklahoma$7,166,115$246,678$787,343$6,132,094
New Hampshire$6,929,945$2,450,608$1,553,811$2,925,526
Nebraska$6,883,958$1,398,115$1,464,837$4,021,006
Connecticut$6,312,343$745,092$113,965$5,453,286
Louisiana$4,956,539$374,592$850,039$3,731,908
Montana$4,390,095$809,589$669,941$2,910,565
New Mexico$3,761,900$422,714$465,550$2,873,636
Utah$3,311,158$323,195$129,959$2,858,004
Arkansas$3,100,937$337,249$280,445$2,483,243
Mississippi$2,828,274$327,699$174,707$2,325,868
District of Columbia$2,623,277$412,819$69,807$2,140,651
Idaho$2,510,083$169,067$252,050$2,088,966
West Virginia$2,138,921$164,465$320,768$1,653,688
Rhode Island$1,926,657$275,932$53,169$1,597,556
Hawaii$1,767,880$215,065$40,789$1,512,026
Wyoming$1,704,012$110,274$296,681$1,297,057
South Dakota$1,703,702$109,573$172,601$1,421,528
Delaware$1,652,094$211,855$42,343$1,397,896
North Dakota$1,225,230$73,470$58,920$1,092,840
Vermont$1,104,000$219,091$46,143$838,766
Learn More on the Voronoi App
If you enjoyed this visualization, check out Top 15 Ranked: America’s Reddest and Bluest Cities Based on County on the Voronoi app.
Related articles