Mapped: Inflation Rates Around the World in 2026
Explore projected inflation rates across 191 countries in 2026, from soaring prices in Venezuela to lower inflation in the U.S. and China.
How Inflation Rates Compare Around the World in 2026
Key Takeaways
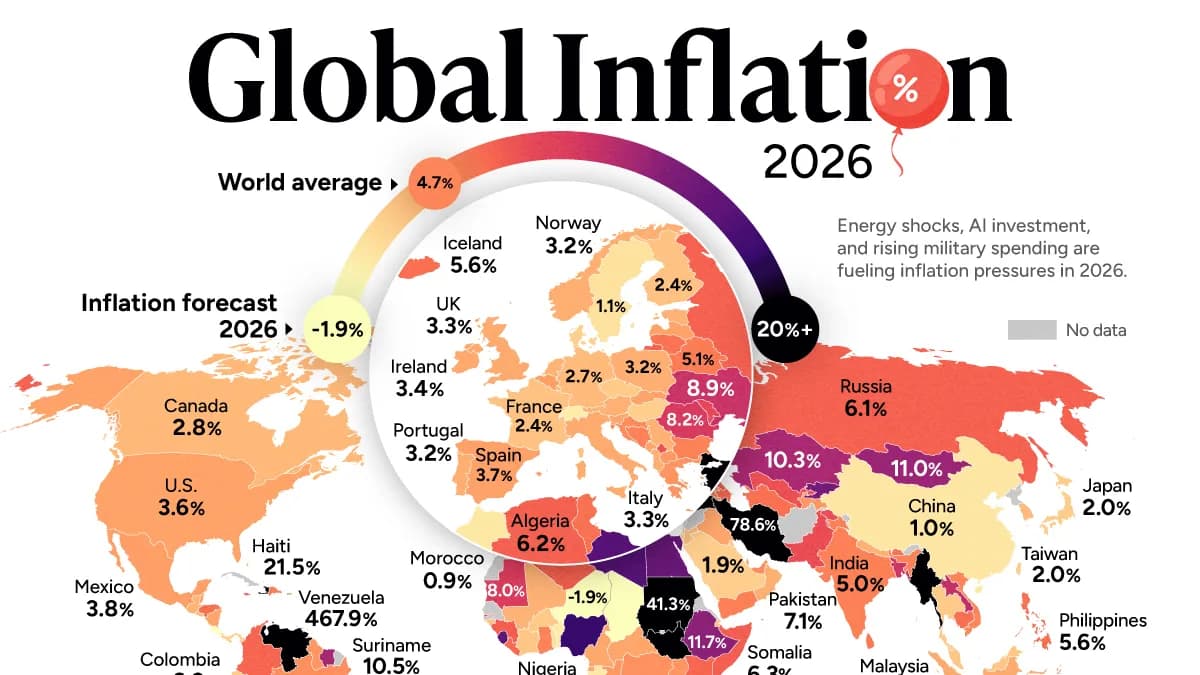
Global inflation is projected to be 4.7% in 2026, with Venezuela facing the world’s highest rate at 467.9%.
U.S. inflation is forecast at 3.6%, compared with 2.8% in Canada and just 1.0% in China.
Three countries are projected to experience deflation, even as inflation exceeds 20% in several economies.
From grocery bills to mortgage payments, inflation remains a major concern for households worldwide. Now, the Iran war and renewed trade tensions are adding fresh pressure to prices, even as some economies see inflation ease.
This graphic maps projected inflation rates across 191 economies in 2026, using data from the IMF’s latest World Economic Outlook.
Where Inflation Is Hitting Hardest in 2026
The table below compares projected inflation rates across 191 economies in 2026.
CountryInflation Rate 2026P (%)
Venezuela467.9
Iran78.6
Sudan41.3
Argentina32.5
Türkiye31.2
South Sudan27.6
Malawi21.9
Haiti21.5
Myanmar20.0
Nigeria15.6
Libya14.1
Sierra Leone13.8
Egypt13.3
Bolivia12.7
Kyrgyzstan12.7
Rwanda12.3
Ethiopia11.7
Mongolia11.0
São Tomé and Príncipe11.0
Angola10.6
Burundi10.5
Suriname10.5
Kazakhstan10.3
Laos9.2
Ukraine8.9
Bangladesh8.7
Marshall Islands8.6
Madagascar8.4
Romania8.2
Mauritania8.0
Zambia8.0
Moldova7.4
Botswana7.2
Pakistan7.1
Gambia7.0
Uzbekistan6.9
Kosovo6.8
Guinea6.3
Somalia6.3
Algeria6.2
Russia6.1
Colombia6.0
Kenya6.0
Jamaica5.9
Liberia5.9
Azerbaijan5.8
Naoero5.7
Bhutan5.6
Cambodia5.6
Honduras5.6
Iceland5.6
Mozambique5.6
Philippines5.6
Turkmenistan5.6
Tunisia5.5
Georgia5.4
Lithuania5.4
Sri Lanka5.3
Belarus5.1
Dominican Republic5.1
Solomon Islands5.1
Bosnia and Herzegovina5.0
India5.0
Yemen5.0
Bulgaria4.9
Ghana4.8
Papua New Guinea4.8
Mauritius4.7
Vietnam4.7
Armenia4.6
Lesotho4.6
Croatia4.5
Kiribati4.5
UAE4.5
Brazil4.4
South Africa4.4
DR Congo4.3
Tuvalu4.3
Fiji4.2
Greece4.2
Uganda4.2
Guyana4.1
Namibia4.1
New Zealand4.1
Tajikistan4.1
Andorra4.0
Comoros4.0
Republic of Congo4.0
Maldives4.0
North Macedonia4.0
Tanzania4.0
Uruguay4.0
Zimbabwe4.0
Australia3.9
Bahamas3.8
Belgium3.8
Mexico3.8
Peru3.8
Tonga3.8
Chile3.7
Cyprus3.7
Spain3.7
Antigua and Barbuda3.6
Latvia3.6
Qatar3.6
Saint Kitts and Nevis3.6
Slovakia3.6
U.S.3.6
Belize3.5
Central African Republic3.5
Iraq3.5
Montenegro3.5
Nicaragua3.5
Slovenia3.5
Cameroon3.4
Ireland3.4
Equatorial Guinea3.3
Indonesia3.3
Italy3.3
UK3.3
Albania3.2
Micronesia3.2
Norway3.2
Oman3.2
Poland3.2
Portugal3.2
Austria3.1
Nepal3.1
Paraguay3.1
Puerto Rico3.1
Serbia3.1
Estonia3.0
Guatemala3.0
Luxembourg3.0
Mali3.0
Eswatini2.9
Netherlands2.9
Saint Lucia2.9
Canada2.8
San Marino2.8
Vanuatu2.8
Dominica2.7
El Salvador2.7
Germany2.7
South Korea2.7
Saint Vincent and the Grenadines2.7
Barbados2.6
Guinea-Bissau2.5
Jordan2.5
Finland2.4
France2.4
Malta2.4
Djibouti2.3
Singapore2.3
Bahrain2.2
Côte d'Ivoire2.2
Kuwait2.2
Malaysia2.2
Burkina Faso2.1
Czech Republic2.1
Thailand2.1
Timor-Leste2.1
Ecuador2.0
Japan2.0
Taiwan2.0
Hong Kong SAR1.9
Hungary1.9
Saudi Arabia1.9
Aruba1.8
Denmark1.8
Israel1.8
Macao SAR1.8
Panama1.8
Grenada1.7
Palau1.7
Samoa1.4
Cabo Verde1.2
Sweden1.1
Togo1.1
China1.0
Morocco0.9
Seychelles0.9
Benin0.8
Brunei Darussalam0.8
Gabon0.8
Trinidad and Tobago0.8
Liechtenstein0.7
Switzerland0.7
Chad-0.7
Costa Rica-0.8
Niger-1.9
The highest inflation rates are concentrated in economies facing severe currency pressures, conflict, or prolonged economic instability. Venezuela, Iran (78.6%), and Sudan (41.3%) stand out, with projected rates far above those of most major economies.
Among the world’s largest economies, the picture is considerably more stable. However, even relatively modest inflation can strain household budgets after years of cumulative price increases.
Lower headline inflation can also mask the true cost of an energy shock. More than 80% of Asia-Pacific economies have introduced subsidies, tax cuts, or price controls to limit the impact on consumers. These measures can keep reported inflation lower in the short term but shift part of the cost onto government budgets.
How the Iran War Is Driving Up Everyday Costs
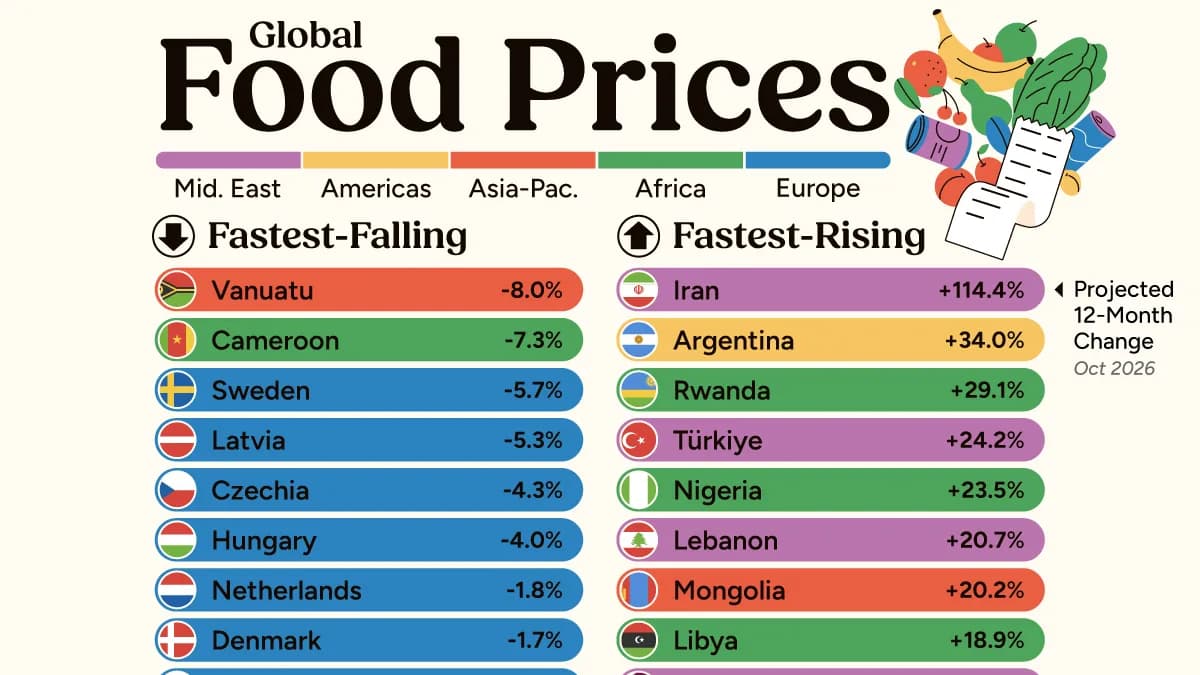
Despite the Iran war, oil exports from the Persian Gulf have recovered sharply, while weaker demand and growing use of alternative energy have helped cushion the shock. The International Energy Agency’s October 2026 report highlights the impact of weaker demand on the global oil market.
Yet energy costs remain elevated, with shipping disruptions and depleted reserves sustaining inflation risks.
Higher energy prices can also affect borrowing costs. If the Iran war keeps inflation elevated, investors may demand higher bond yields, putting upward pressure on U.S. mortgage rates. As of October 22, the average 30-year mortgage rate stood at 7.32%, up from 6.19% a year earlier. On a new $400,000 mortgage, that difference amounts to roughly $3,700 more in annual principal and interest payments.
Will Inflation Get Worse in 2027?
Global inflation is projected to slow from 4.7% in 2026 to 4.1% in 2027, although the outlook remains sensitive to energy prices, trade disruptions, and geopolitical developments.
For households, slowing inflation would mean prices rising more gradually, not returning to previous levels. A prolonged energy disruption could also push prices higher while slowing economic growth, leaving central banks with fewer options to provide relief.
Learn More on the Voronoi App
To learn more about this topic, explore this graphic showing where inflation has hit different goods and services hardest from 2000 to 2025.
Source: https://www.visualcapitalist.com/mapped-inflation-rates-around-the-world-in-2026/
Related articles