Mapped: Internet Censorship Around the World
Which countries censor the internet most? Explore government censorship worldwide, from North Korea and China to the U.S. and Europe.
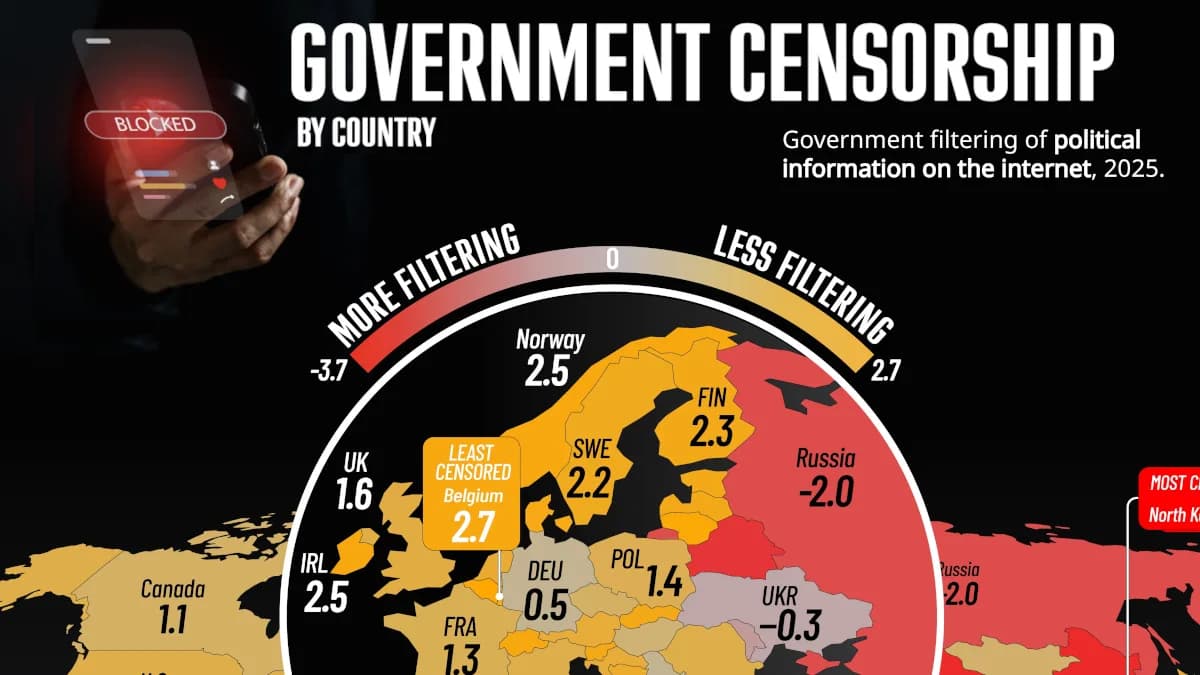
How Internet Censorship Varies Around the World
Key Takeaways:
North Korea (-3.74) has the most restrictive government filtering of political information online, followed by Ethiopia (-3.26) and Algeria (-3.23).
Saudi Arabia and the UAE rank among the five most restrictive countries, despite having near-universal internet access.
European countries dominate the least restrictive end of the rankings, led by Belgium, Lithuania, and Luxembourg.
Governments around the world vary dramatically in how much they restrict political information online, with some countries imposing extensive controls over what citizens can access.
This visualization uses the Digital Society Project’s Digital Society Survey, Version 8 (2026) to compare government filtering of political information across 179 countries in 2025.
Which Countries Censor the Internet Most?
The following table shows government filtering scores from the Digital Society Project, with lower scores indicating more censorship. Scores are expert estimates, not percentages.
RankCountryOverall ScoreSocial Media Censorship ScoreSocial Media Monitoring Score
1 North Korea-3.74-3.72-3.59
2 Ethiopia-3.26-2.89-2.33
3 Algeria-3.23-1.23-2.12
4 Saudi Arabia-3.21-1.19-3.44
5 United Arab Emirates-3.21-2.08-1.92
6 Turkmenistan-3.09-3.48-2.46
7 China-2.82-3.01-3.32
8 Nicaragua-2.78-2.26-1.46
9 Vietnam-2.71-1.45-2.35
10 Eritrea-2.69-2.64-2.23
11 Iran-2.66-2.24-1.92
12 Belarus-2.50-0.49-1.69
13 Cambodia-2.41-0.68-1.02
14 Sudan-2.36-1.38-1.67
15 Cuba-2.20-0.86-0.69
16 Togo-2.16-1.28-1.93
17 Venezuela-2.15-0.82-1.69
18 Tajikistan-2.14-2.23-2.90
19 Russia-2.00-2.38-2.75
20 Türkiye-1.98-0.95-1.24
21 Bahrain-1.93-0.78-1.61
22 Qatar-1.91-1.62-2.80
23 Egypt-1.84-0.79-1.71
24 Republic of the Congo-1.81-1.21-1.15
25 Tanzania-1.70-0.76-1.52
26 Burma/Myanmar-1.68-2.94-2.71
27 Oman-1.59-1.28-1.73
28 Azerbaijan-1.52-1.35-2.17
29 South Sudan-1.50-2.96-2.77
30 Yemen-1.46-1.54-0.95
31 Rwanda-1.46-1.57-2.03
32 Kazakhstan-1.45-1.18-1.08
33 Uzbekistan-1.39-1.84-1.53
34 Afghanistan-1.37-1.82-1.51
35 Uganda-1.34-1.32-1.76
36 Burkina Faso-1.34-0.72-2.71
37 Equatorial Guinea-1.31-1.46-2.81
38 Hong Kong-1.21-0.95-0.90
39 Pakistan-1.13-0.54-1.07
40 Laos-1.11-0.78-0.73
41 Nigeria-1.091.09-0.43
42 India-1.09-0.65-0.78
43 Ivory Coast-1.05-0.05-2.28
44 Thailand-0.90-0.06-1.19
45 Kyrgyzstan-0.89-0.69-0.51
46 Bhutan-0.87-0.92-1.03
47 Syria-0.85-0.42-0.93
48 Chad-0.78-1.19-1.19
49 Zanzibar-0.78-1.17-0.78
50 Jordan-0.75-1.14-0.70
51 Palestine/West Bank-0.710.77-0.94
52 Singapore-0.68-0.61-1.32
53 Djibouti-0.66-1.55-1.02
54 Morocco-0.65-0.65-0.89
55 Guinea-0.62-0.420.05
56 Guinea-Bissau-0.540.240.03
57 Moldova-0.51-0.13-0.45
58 Senegal-0.48-0.47-0.14
59 Kuwait-0.35-1.14-1.37
60 Ukraine-0.35-0.07-1.27
61 Democratic Republic of the Congo-0.31-0.020.00
62 Suriname-0.261.890.43
63 Somalia-0.21-0.03-0.29
64 Ecuador-0.150.05-0.13
65 Sri Lanka-0.140.840.66
66 Niger-0.100.481.20
67 Zimbabwe-0.10-0.29-1.48
68 Bangladesh-0.03-0.880.88
69 Mali-0.03-0.87-1.17
70 Mauritania0.01-0.81-1.15
71 Eswatini0.03-0.15-1.56
72 Georgia0.12-0.47-1.19
73 Maldives0.16-0.55-0.04
74 Colombia0.160.47-0.62
75 Malaysia0.300.18-0.46
76 Central African Republic0.310.471.25
77 Iraq0.39-0.40-0.65
78 Mozambique0.40-0.560.50
79 Papua New Guinea0.411.390.68
80 Lebanon0.44-0.81-0.37
81 Cameroon0.46-1.52-0.88
82 Nepal0.48-1.11-0.08
83 Albania0.501.350.73
84 Gabon0.510.140.62
85 Germany0.520.740.37
86 Serbia0.530.58-0.53
87 Tunisia0.591.501.15
88 Philippines0.610.40-1.28
89 Libya0.61-0.090.35
90 Fiji0.61-0.02-0.72
91 Comoros0.630.36-1.28
92 Angola0.650.87-0.03
93 Madagascar0.651.10-0.86
94 Indonesia0.710.15-0.90
95 Guyana0.720.29-1.22
96 Palestine/Gaza0.72-0.89-1.28
97 Bolivia0.731.84-0.22
98 North Macedonia0.780.740.14
99 Liberia0.800.560.99
100 Kenya0.830.78-0.57
101 Zambia0.842.120.02
102 Israel0.900.64-0.48
103 Hungary0.940.680.52
104 South Africa0.941.790.64
105 Panama0.961.581.01
106 Burundi0.98-0.800.00
107 Mongolia0.990.900.48
108 Sierra Leone0.990.951.59
109 Taiwan1.010.450.46
110 Canada1.071.420.83
111 Somaliland1.11-0.26-0.61
112 Namibia1.131.46-0.01
113 Czechia1.141.680.79
114 Brazil1.151.550.61
115 Dominican Republic1.162.001.15
116 Greece1.180.841.15
117 Argentina1.241.16-0.27
118 France1.250.741.20
119 Armenia1.281.330.24
120 Malawi1.291.02-0.69
121 Mauritius1.32-0.05-0.52
122 Costa Rica1.371.251.50
123 Barbados1.401.321.17
124 Poland1.422.080.88
125 Lesotho1.420.090.60
126 New Zealand1.431.750.91
127 Chile1.431.851.46
128 South Korea1.481.652.04
129 Italy1.491.821.24
130 United States of America1.531.06-0.11
131 El Salvador1.540.540.46
132 Romania1.550.580.44
133 Kosovo1.551.100.61
134 Ghana1.580.890.74
135 Benin1.590.53-0.06
136 United Kingdom1.620.860.94
137 Solomon Islands1.651.351.91
138 Timor-Leste1.661.061.33
139 Cape Verde1.671.231.05
140 Austria1.752.181.40
141 Japan1.761.682.30
142 Malta1.772.020.16
143 Mexico1.791.430.22
144 Croatia1.821.611.21
145 Netherlands1.850.930.78
146 Guatemala1.882.140.99
147 Vanuatu1.891.651.09
148 Botswana1.911.932.28
149 The Gambia1.931.132.39
150 Montenegro1.931.520.95
151 Sao Tome and Principe1.941.461.19
152 Spain1.981.531.52
153 Bosnia and Herzegovina1.990.871.33
154 Trinidad and Tobago2.071.820.32
155 Peru2.091.261.98
156 Honduras2.101.750.17
157 Australia2.100.661.36
158 Paraguay2.121.881.35
159 Jamaica2.161.820.32
160 Iceland2.191.912.74
161 Sweden2.192.142.99
162 Haiti2.210.781.06
163 Portugal2.262.302.53
164 Estonia2.281.661.31
165 Bulgaria2.291.801.36
166 Slovenia2.322.082.35
167 Slovakia2.332.101.31
168 Seychelles2.331.581.92
169 Latvia2.342.100.69
170 Finland2.351.912.62
171 Uruguay2.362.012.12
172 Denmark2.371.592.17
173 Cyprus2.381.610.96
174 Ireland2.452.121.12
175 Switzerland2.482.072.20
176 Norway2.502.112.29
177 Luxembourg2.551.961.68
178 Lithuania2.561.651.53
179 Belgium2.702.110.76
One striking result is that several countries rank as more restrictive than China (-2.82) and Russia (-2.00). Ethiopia, Algeria, Saudi Arabia, and the UAE all score lower on government filtering of political information, highlighting how the rankings differ from common perceptions.
At the opposite end, Belgium (2.70) and Lithuania (2.56) are among the countries with the least restrictive filtering.
Why Is Internet Censorship So High in the Middle East?
Saudi Arabia and the UAE illustrate the difference between connectivity and freedom. Both report 100% internet usage, as do Bahrain and Kuwait, while Qatar exceeds 98%.
High internet penetration, however, does not guarantee unrestricted political expression. Governments can maintain widespread connectivity while blocking sensitive political content, restricting websites, or penalizing online criticism.
Freedom House has documented restrictions on political content and arrests related to online expression across the region, illustrating how widespread internet access can coexist with extensive censorship.
Asia’s Divided Internet
Asia shows striking differences. China (-2.82) and Vietnam (-2.71) impose substantial filtering, while Japan (1.76) and South Korea (1.48) are comparatively open.
Across Southeast Asia, governments have increasingly pressured platforms to remove content, according to Deutsche Welle.
Why Europe and North America Score Better
Nordic countries perform strongly, including Norway (2.50), Denmark (2.37), Finland (2.35), and Sweden (2.19). European privacy protections generally regulate how personal data is handled rather than restrict political criticism, allowing strong privacy laws to coexist with relatively open political discourse.
The United States (1.53) scores above Canada (1.07), France (1.25), and Germany (0.52). Constitutional protections for political speech may help explain the U.S. score, although this measure does not capture every form of platform moderation or surveillance.
The U.S. also illustrates an important distinction between censorship and surveillance. While it scores relatively well on government filtering of political information (1.53), its government social media monitoring score is considerably lower (-0.11).
This suggests that relatively open access to political information does not necessarily mean limited government monitoring of online activity. The two measures capture different dimensions of internet freedom.
Learn More on the Voronoi App
Explore another dimension of global connectivity with The Fastest Mobile Internet Speeds by Country, comparing mobile internet performance worldwide.
Source: https://www.visualcapitalist.com/mapped-internet-censorship-around-the-world/
Get the latest news delivered to your inbox.
Related articles