Ranked: Which Countries Drink the Most Coffee?
The U.S. and Brazil drink 27.6% of the world's coffee, more than the next six countries combined. See how global coffee consumption compares.
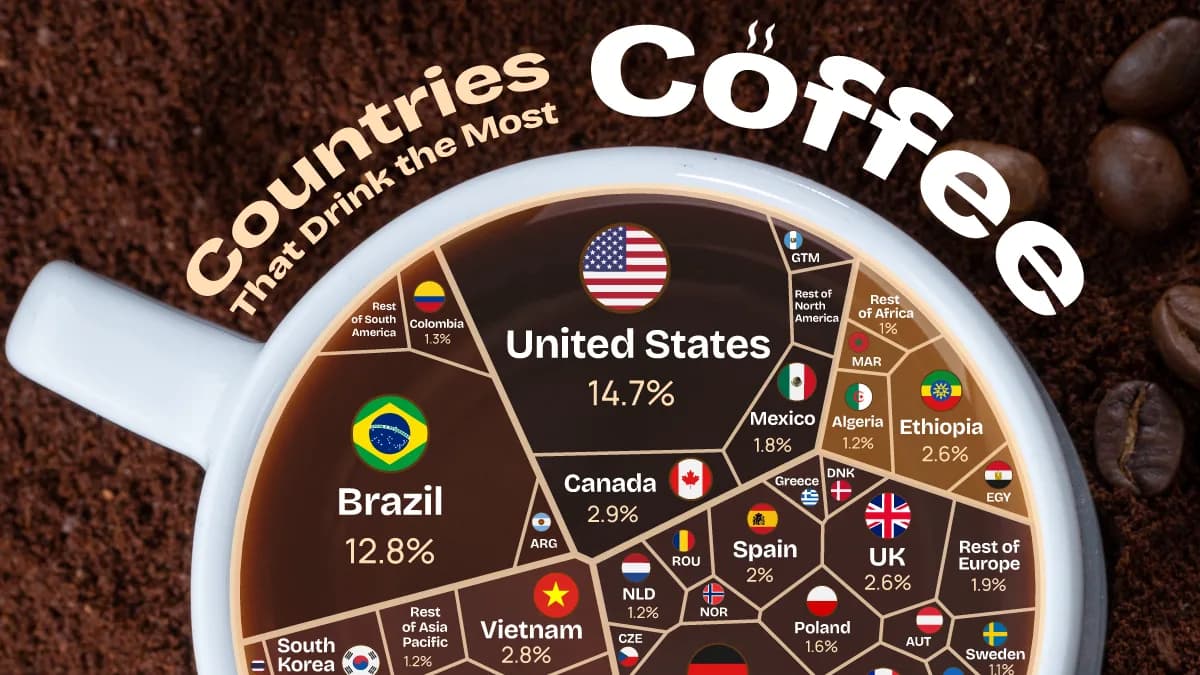
Which Countries Consume the Most Coffee?
Key Takeaways
The U.S. (14.7%) and Brazil (12.8%) drink over a quarter of the world’s coffee, more than the next six countries combined.
The Philippines ranks fifth worldwide (3.8%), ahead of China, France, Italy, and several other major coffee markets.
Coffee is a daily staple around the world, but the countries consuming the largest volumes aren’t necessarily those most famous for their coffee cultures.
This graphic ranks 96 countries by their share of global coffee consumption in the 2025/26 marketing year, using data from the USDA Foreign Agricultural Service and the European Coffee Federation.
Consumption is measured in 60-kilogram bags, green bean equivalent, with the European Union total split among member countries using 2024 sales shares.
U.S. and Brazil Drink Over a Quarter of the World’s Coffee
The world’s eight largest coffee-consuming countries account for 51.1% of global demand, with Germany, Japan, the Philippines, and China joining the U.S. and Brazil among the leading markets.
These rankings measure total consumption rather than coffee consumed per person, giving populous countries an advantage over smaller nations with strong coffee-drinking traditions.
The table below ranks all 96 covered markets by their share of global coffee consumption and total volume in thousands of 60-kilogram bags:
RankCountryShare of World Total (%)Coffee Consumption (Thousand 60-kg Bags)
1 United States14.725,550
2 Brazil12.822,280
3 Germany6.411,079
4 Japan3.86,653
5 Philippines3.86,525
6 China3.76,420
7 Canada2.95,050
8 France2.95,033
9 Vietnam2.84,900
10 Indonesia2.84,810
11 Russia2.64,575
12 United Kingdom2.64,570
13 Ethiopia2.64,500
14 Italy2.44,137
15 Spain2.03,534
16 South Korea1.83,200
17 Mexico1.83,160
18 Poland1.62,816
19 Australia1.52,535
20 Colombia1.32,200
21 Netherlands1.22,069
22 Algeria1.22,050
23 Sweden1.11,848
24 Türkiye1.01,750
25 India0.91,575
26 Saudi Arabia0.81,350
27 Romania0.71,235
28 Switzerland0.71,200
29 Egypt0.71,175
30 Austria0.61,116
31 Ukraine0.61,110
32 Belgium0.61,002
33 Finland0.5931
34 Thailand0.5925
35 Morocco0.5910
36 Guatemala0.5875
37 Argentina0.5815
38 Taiwan0.5810
39 Greece0.5797
40 Norway0.5795
41 Jordan0.4770
42 Denmark0.4736
43 Portugal0.4735
44 Hungary0.4717
45 Iran0.4700
46 Czechia0.4689
47 South Africa0.4685
48 Serbia0.4680
49 Bulgaria0.4621
50 Croatia0.3560
51 Kazakhstan0.3560
52 New Zealand0.3515
53 Malaysia0.3500
54 Venezuela0.3500
55 Slovakia0.2414
56 Honduras0.2380
57 Slovenia0.2376
58 Ecuador0.2363
59 El Salvador0.2332
60 Uganda0.2330
61 Costa Rica0.2320
62 Lithuania0.2309
63 Ireland0.2308
64 Bosnia and Herzegovina0.2300
65 Peru0.2300
66 Chile0.1230
67 Armenia0.1220
68 Madagascar0.1210
69 Panama0.1170
70 Nicaragua0.1160
71 Albania0.1110
72 Dominican Republic0.1110
73 DR Congo0.1100
74 Singapore0.1100
75 Cuba0.190
76 Laos0.188
77 Tanzania0.085
78 Georgia0.080
79 North Macedonia0.075
80 Senegal0.075
81 Kosovo0.070
82 Cyprus0.069
83 Cameroon0.065
84 Luxembourg0.064
85 Kenya0.062
86 Côte d'Ivoire0.050
87 Papua New Guinea0.050
88 Bolivia0.045
89 Montenegro0.040
90 Malta0.039
91 Uruguay0.035
92 Guinea0.025
93 Burundi0.015
94 Angola0.012
95 Sierra Leone0.010
96 Jamaica0.04
-- World Total100.0173,459
Figures may not sum to the world total due to rounding.
The U.S. leads with 25.6 million bags consumed, supported by a large population of regular coffee drinkers. According to the National Coffee Association, 66% of American adults drink coffee every day. That broad consumer base makes the U.S. the world’s top coffee importer, even though it grows almost none of its own beans.
By contrast, Brazil (22.3 million bags) and Africa’s largest coffee market, Ethiopia (4.5 million bags), are both major producers that retain more than a third of their harvests for domestic consumption. This helps explain why both countries rank ahead of several wealthier importing nations.
Asia Has Five Nations in the Top 10, Yet Europe Leads Overall
Asia Pacific accounts for 23.3% of global coffee consumption, with five countries in the top 10. Japan and the Philippines lead the region at 3.8% each, followed closely by China at 3.7%.
Major coffee producers Vietnam and Indonesia (2.8% each) meet much of their domestic demand through local harvests, while the Philippines relies heavily on imported coffee products.
Instant coffee accounts for 94% of Philippine coffee consumption, making the country the world’s largest importer of soluble coffee.
Meanwhile, China’s coffee consumption has nearly tripled over the past decade, bringing it close to overtaking fourth-place Japan in total volume.
Europe leads all regions with 31.6% of global consumption, spread across 36 countries. Germany (6.4%) and France (2.9%) are the only European countries in the global top 10.
Coffee is also deeply embedded in European culture. Italy’s espresso tradition centers on short, strong coffees served in neighborhood bars, while Sweden’s fika makes coffee a regular occasion to pause and socialize, including during the workday.
Sweden provides a striking example of how coffee habits can outweigh population size. Despite having a fraction of India’s population, Sweden accounts for 1.1% of global coffee consumption compared with India’s 0.9%.
This contrast highlights why rankings based on total consumption can look very different from those measuring how much coffee the average person drinks.
Learn More on the Voronoi App
If you enjoyed today’s post, check out Global Coffee Production by Country on Voronoi.
Get the latest news delivered to your inbox.
Related articles