The World’s Natural Gas Prices Over Time (2006–2026)
Compare natural gas prices across U.S., European, and Asian benchmarks and explore the Shale Crescent’s industrial cost advantage.
This story was prepared automatically by software.
Published
October 20, 2026 8:44 am
By
Design
Athul Alexander
Akhila Ayyalasomayajula
The following content is sponsored by Shale Crescent USA
Save to Inbox
×
Save to Inbox
Sign me up for the free Visual Capitalist daily newsletter.
Send
Where Are Natural Gas Prices the Lowest?
Key Takeaways
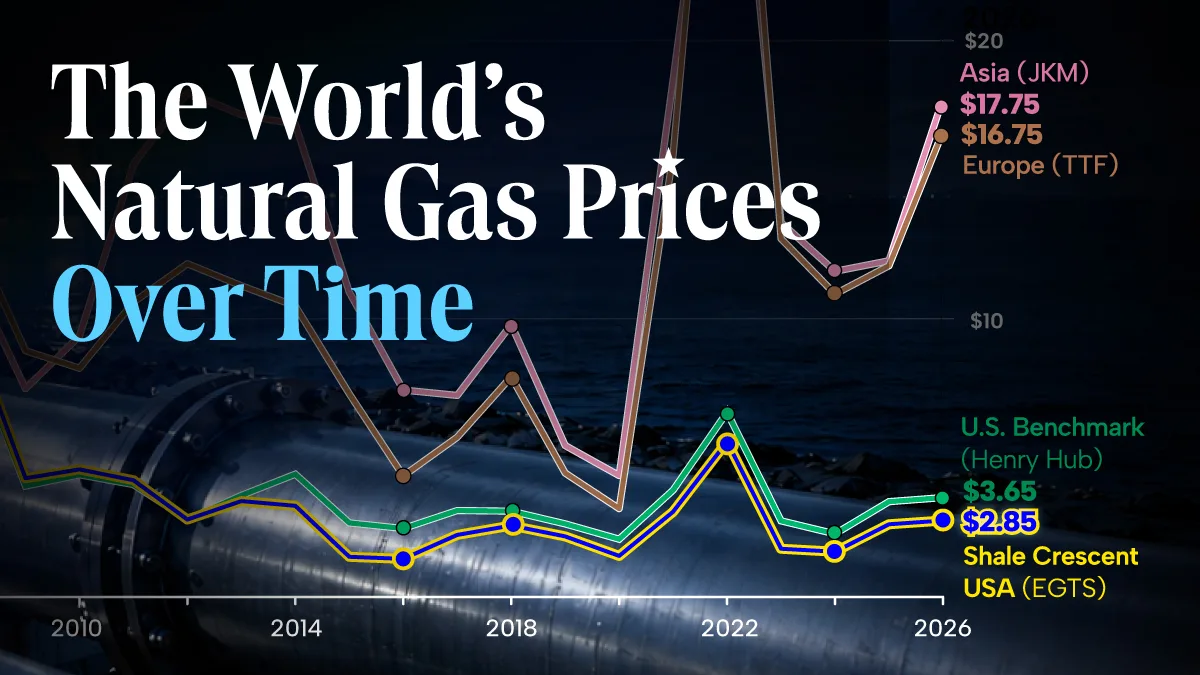
From 2006–2025, the Shale Crescent’s annual prices stayed below the European and Asian prices.
In January–September 2026, Shale Crescent USA (EGTS) averaged $2.85/MMBtu—about 22% below Henry Hub and about 83% below Europe’s TTF and Asia’s JKM.
The long-running price gap gives energy-intensive businesses a potential cost advantage to consider when choosing a location.
Energy costs can influence where companies build and expand. For energy-intensive businesses, lower natural gas prices can create an important operating advantage.
This graphic, in partnership with Shale Crescent USA, shows regional natural gas prices using data from the IMF series available through FRED for European gas and Asian LNG.
Twenty Years Below Overseas Benchmarks
From 2006–2025, the Shale Crescent’s annual prices stayed below European and Asian hubs. Moreover, the regional series undercut the U.S. benchmark Henry Hub in every full year from 2012 onward, using unrounded averages.
Here is a table that shows annual benchmark prices from 2000 through 2026 YTD in $/MMBtu.
YearU.S. Benchmark
(Henry Hub)Shale Crescent USA
(EGTS)Europe
(TTF)Asia
(JKM)
2000$3.89$4.12$3.45$5.24
2001$4.27$4.57$3.87$4.67
2002$3.22$3.41$2.67$4.43
2003$5.39$5.95$3.49$4.98
2004$6.14$6.49$3.76$5.89
2005$8.62$9.04$5.92$7.03
2006$7.23$7.55$8.21$8.05
2007$6.86$7.22$8.14$8.41
2008$9.03$9.53$13.14$11.59
2009$3.99$4.27$8.86$7.49
2010$4.39$4.59$8.22$9.38
2011$4.04$4.20$10.60$15.55
2012$2.79$2.79$11.98$18.15
2013$3.65$3.45$11.19$17.34
2014$4.41$3.28$10.46$17.00
2015$2.66$1.44$7.31$10.96
2016$2.46$1.37$4.35$7.44
2017$3.11$2.23$5.74$7.25
2018$3.09$2.57$7.92$9.80
2019$2.63$2.18$4.45$5.44
2020$2.08$1.48$3.18$4.37
2021$3.84$3.06$15.91$18.60
2022$6.64$5.59$37.52$33.30
2023$2.74$1.73$12.88$13.46
2024$2.27$1.63$10.89$11.71
2025$3.43$2.61$11.91$12.09
2026 YTD (Jan–Sep)$3.65$2.85$16.75$17.75
Annual values are averages of monthly prices.
For example, the region averaged $5.59 per million British thermal units (MMBtu) in 2022. By comparison, Europe’s series averaged $37.52, while Asia’s averaged $33.30.
Russia’s 2022 invasion of Ukraine and LNG shipping disruptions during the 2026 Iran war drove overseas gas prices higher. However, the Shale Crescent’s average prices remained far below European and Asian benchmarks, preserving its cost advantage.
Just four years later, from January through September 2026, Shale Crescent USA (EGTS) averaged $2.85/MMBtu. In contrast, the U.S. benchmark, Henry Hub, averaged $3.65/MMBtu.
Europe’s TTF averaged $16.75/MMBtu, while Asia’s JKM averaged $17.75/MMBtu. As a result, EGTS was about 22% below Henry Hub and about 83% below the overseas benchmarks.
A Location Advantage for Industry
For manufacturers, that gap makes energy costs an important part of site selection. Lower gas costs can support competitive production budgets and leave more room for investment.
A company’s gas consumption determines how strongly these price differences affect operating costs. That makes the comparison especially relevant for energy-intensive projects.
However, benchmark prices do not equal every company’s delivered energy bill. Businesses should assess transportation charges, utility access, and contract terms alongside the regional price advantage.
Ultimately, the Shale Crescent’s long-running price advantage strengthens its case for energy-intensive investment. It offers businesses a concrete cost factor to assess when choosing where to grow.
You may also like
- Energy1 month ago Ranked: U.S. Natural Gas vs. Countries See how U.S. natural gas production regions compare with leading countries worldwide.
- Energy2 months ago Mapped: Where is U.S. Natural Gas Produced? U.S. regional natural gas production in 2026 shows Appalachia leading the nation, reinforcing the Shale Crescent’s industrial edge.
- Energy12 months ago The Future of U.S. Natural Gas Production, by Region EIA projections show the East—powered by the Shale Crescent—leading U.S. natural gas through 2050. Here’s how this shift can translate into a lasting manufacturing cost advantage.
- Energy12 months ago Ranked: The Lowest Cost Energy Sources Shale Crescent USA’s natural gas ranks as the lowest cost energy on a $/BOE basis—outpacing NYMEX, coal, oil, and imported LNG—and offers a manufacturing edge.
- Energy1 year ago Who is Growing? U.S. Natural Gas Leaders Which U.S. regions lead natural gas production growth? See why the Shale Crescent is now fueling millions more homes and factories.
- Energy1 year ago Visualized: Where is the Most Natural Gas Production? See how natural gas production stacks up globally and why the Shale Crescent ranks third—a strategic edge for U.S. manufacturing.
- Energy1 year ago Shale Crescent USA: A World-Class Manufacturing Region Shale Crescent USA brings energy, customers, and infrastructure together in one region, helping manufacturers reduce costs as reshoring accelerates.
Subscribe
Source: https://www.visualcapitalist.com/sp/sc02-the-worlds-natural-gas-prices-over-time-2006-2026/
Related articles