
All of the World’s Beer Brewed in 2025, by Country
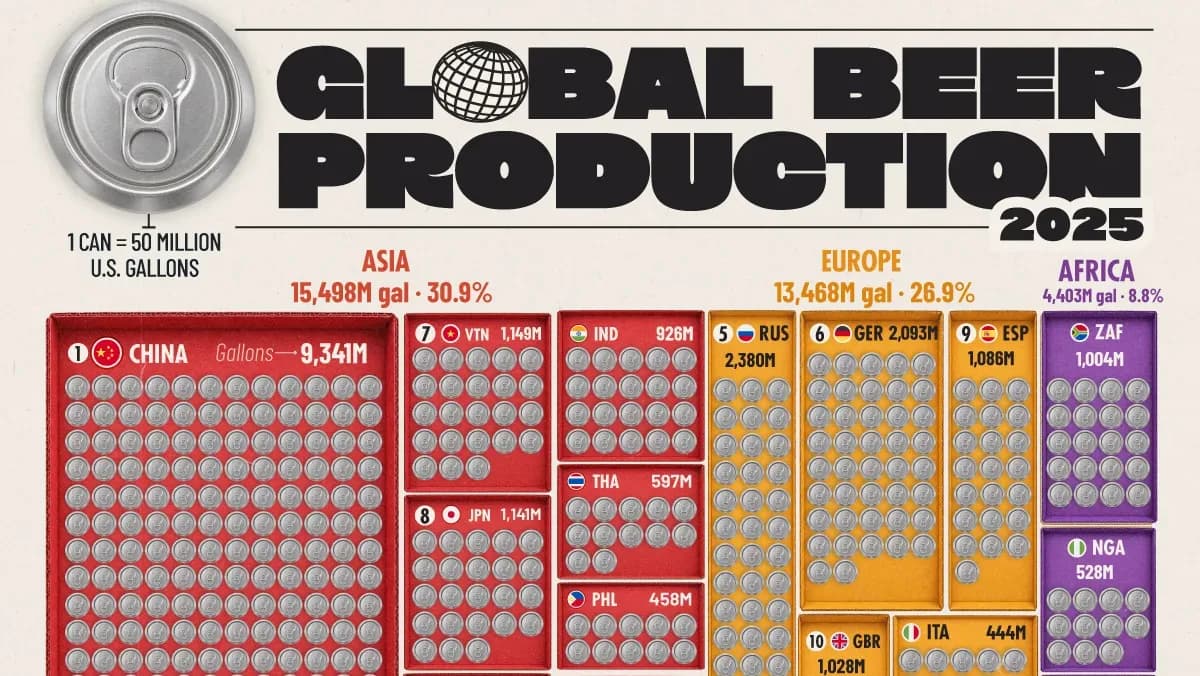
The world's 10 largest beer-producing countries accounted for 62% of global production in 2025.
Where Is All the World’s Beer Brewed?
Key Takeaways
China produced 9.34 billion U.S. gallons of beer in 2025, accounting for 18.7% of global output.
China brewed more than twice as much beer as the United States, the world’s second-largest producer.
The world’s 10 largest beer-producing countries accounted for more than 61% of global production.
The world brewed nearly 1.9 billion hectoliters of beer in 2025, equivalent to roughly 50.1 billion U.S. gallons. While Europe has a long brewing tradition, some of the world’s largest producers are in Asia and the Americas.
This visualization ranks countries by beer production in 2025, using data from the BarthHaas Report 2025/2026.
China Leads Global Beer Production by a Wide Margin
China is the world’s largest beer producer, with 9.34 billion gallons brewed in 2025. Its output exceeded that of the United States and Brazil combined.
RankCountry / GroupRegion2025 U.S. gallons (million)Global share
1 ChinaAsia9,34118.7%
2 USAAmerica4,6219.2%
3 BrazilAmerica3,9928.0%
4 MexicoAmerica3,9067.8%
5 RussiaEurope2,3804.8%
6 GermanyEurope2,0934.2%
7 VietnamAsia1,1492.3%
8 JapanAsia1,1412.3%
9 SpainEurope1,0862.2%
10 UKEurope1,0282.1%
11 South AfricaAfrica1,0042.0%
12 IndiaAsia926.21.9%
13 PolandEurope848.51.7%
14 ColombiaAmerica754.21.5%
15 ThailandAsia596.51.2%
16 NetherlandsEurope573.31.1%
17 FranceEurope560.01.1%
18 BelgiumEurope541.61.1%
19 CanadaAmerica536.31.1%
20 NigeriaAfrica528.31.1%
21 Czech RepublicEurope527.31.1%
22 ArgentinaAmerica520.21.0%
23 PhilippinesAsia457.70.9%
24 ItalyEurope443.80.9%
25 CambodiaAsia422.70.8%
26 AngolaAfrica415.10.8%
27 PeruAmerica405.50.8%
28 EthiopiaAfrica383.00.8%
29 South KoreaAsia372.70.7%
30 AustraliaOceania367.20.7%
31 RomaniaEurope360.60.7%
32 UkraineEurope354.80.7%
33 TurkeyEurope325.10.7%
34 ChileAmerica302.70.6%
35 IrelandEurope263.40.5%
36 CameroonAfrica251.00.5%
37 AustriaEurope244.40.5%
38 PortugalEurope206.10.4%
39 EcuadorAmerica183.20.4%
40 LaosAsia163.80.3%
41 SerbiaEurope153.20.3%
42 GuatemalaAmerica142.90.3%
43 DenmarkEurope140.00.3%
44 KazakhstanAsia135.70.3%
45 TanzaniaAfrica134.10.3%
46 VenezuelaAmerica133.20.3%
47 DRCAfrica132.10.3%
48 Ivory CoastAfrica130.60.3%
49 TaiwanAsia126.80.3%
50 HungaryEurope124.90.3%
51 BulgariaEurope121.00.2%
52 Dominican RepublicAmerica119.10.2%
53 KenyaAfrica116.20.2%
54 MozambiqueAfrica115.80.2%
55 GreeceEurope113.90.2%
56 SwedenEurope109.60.2%
57 UgandaAfrica109.50.2%
58 MyanmarAsia103.00.2%
59 GhanaAfrica102.00.2%
60 BelarusEurope100.80.2%
61 CongoAfrica98.00.2%
62 BoliviaAmerica96.70.2%
63 FinlandEurope95.10.2%
64 PanamaAmerica91.10.2%
65 SwitzerlandEurope89.20.2%
66 MalaysiaAsia88.40.2%
67 Burkina FasoAfrica84.50.2%
68 IndonesiaAsia82.10.2%
69 CroatiaEurope81.90.2%
70 LithuaniaEurope81.90.2%
71 SlovakiaEurope77.90.2%
72 ParaguayAmerica77.40.2%
73 UzbekistanAsia74.30.2%
74 ZimbabweAfrica70.20.1%
75 New ZealandOceania68.70.1%
76 ZambiaAfrica65.50.1%
77 CubaAmerica64.80.1%
78 BurundiAfrica63.60.1%
79 NorwayEurope60.40.1%
80 GabonAfrica53.60.1%
81 IsraelAsia52.80.1%
82 NamibiaAfrica52.00.1%
83 SloveniaEurope47.60.1%
84 TunisiaAfrica46.30.1%
85 UruguayAmerica45.10.1%
86 NepalAsia44.80.1%
87 RwandaAfrica44.80.1%
88 Sri LankaAsia44.40.1%
89 LesothoAfrica43.20.1%
90 Costa RicaAmerica42.10.1%
91 MoldovaEurope41.20.1%
92 HondurasAmerica40.20.1%
93 AlgeriaAfrica39.60.1%
94 MadagascarAfrica39.10.1%
95 GeorgiaEurope37.70.1%
96 El SalvadorAmerica35.50.1%
97 BeninAfrica34.80.1%
98 NicaraguaAmerica32.70.1%
99 TogoAfrica32.10.1%
100 SingaporeAsia31.70.1%
101 MongoliaAsia31.70.1%
102 MalawiAfrica30.20.1%
103 EstoniaEurope29.10.1%
104 Puerto RicoAmerica28.20.1%
105 ChadAfrica25.40.1%
106 EgyptAfrica25.10.1%
107 IranAsia23.80.1%
108 AlbaniaEurope23.80.1%
109 MoroccoAfrica22.20.0%
110 BotswanaAfrica21.70.0%
111 LatviaEurope19.80.0%
112 Bosnia-HerzegovinaEurope18.60.0%
113 Papua New GuineaOceania17.70.0%
114 North MacedoniaEurope17.40.0%
115 MauritiusAfrica17.20.0%
116 TrinidadAmerica15.90.0%
117 KyrgyzstanAsia14.60.0%
118 AzerbaijanAsia14.30.0%
119 BhutanAsia13.50.0%
--RestAsia46.10.1%
--RestAfrica72.70.2%
--RestAmerica54.10.1%
--RestEurope47.20.1%
--RestOceania16.60.0%
--WORLDGlobal50,081100.0%
China’s modern beer industry traces its roots to Harbin, a northeastern city near the Russian border, where the country’s first European-style brewery was established in 1900.
The United States ranked second with 4.62 billion gallons, followed by Brazil and Mexico, which accounted for 8.0% and 7.8% of global production, respectively.
Six Countries Produce More Than Half the World’s Beer
China, the United States, Brazil, and Mexico together accounted for 43.7% of global beer production in 2025. Adding Russia and Germany brings the combined share of the six largest producers to 52.7%.
Germany’s sixth-place position is notable given its long brewing tradition. It trails both Brazil and Mexico, while Russia ranks as Europe’s largest beer producer.
Production volumes drop sharply beyond the top six. Vietnam and Japan, ranked seventh and eighth, each accounted for 2.3% of global output, while Spain and the United Kingdom rounded out the top 10.
A Global Industry Shaped by Major Brewers
Many of the world’s largest beer companies, including AB InBev, Heineken, Carlsberg, and major Chinese brewers, operate across numerous markets and manage portfolios of internationally recognized brands.
China’s position at the top reflects the scale of its domestic brewing industry, which includes several companies among the world’s largest brewers.
Many of the leading producers are also among the world’s biggest beer markets by total consumption. Large populations and established beer markets help support substantial domestic brewing capacity.
However, per-capita consumption tells a different story, with smaller European countries often standing out.
Czechia leads the world for the 32nd consecutive year, with beer consumption nearing 150 liters (40 gallons) per person annually, despite ranking just 21st in global beer production.
Learn More on the Voronoi App
If you enjoyed today’s post, check out this graphic about alcohol preferences around the world.
Related articles

Anthropic adds live dashboards and animated explainers to Claude with Dashboards and Motion
Anthropic launched Claude Dashboards, which builds auto-updating dashboards from data platforms and CRMs, and Claude Motion, which turns reports and charts into editable animations, in beta, while making Docs, Slides and Design available on every plan.

Microsoft launches Microsoft-Decision-1, a fast decision-scoring model, on Foundry and OpenRouter
Microsoft released Microsoft-Decision-1, a model that returns calibrated probabilities over fixed options instead of generating text. Microsoft says it topped a 36-benchmark comparison and ran 35 times faster than GPT-6 Sol.

Microsoft’s Satya Nadella says advanced AI needs a human-controlled ‘emergency brake’
Microsoft CEO Satya Nadella urged the industry to treat frontier AI models like insider risks, wrapping them in containment, independent controls and an “emergency brake” that lets an authorized person pause or shut down a model mid-task.

Amazon in talks to buy AI startup Decart for around $7 billion, WSJ reports
Amazon is negotiating to acquire Decart, maker of real-time video-editing and robotics-simulation AI models, in a deal that could be valued at about $7 billion, The Wall Street Journal reported. Decart was valued at nearly $4 billion in May.
Energy-importing countries record 3x faster clean energy generation than exporters
A new report has revealed that energy-importing countries are scaling clean energy generation three times...
Meteorite, desert soil and AI: New electrical method takes aim at hunt for alien life
Researchers in Japan have developed an electrical method that tells mirror-image forms of amino acids...