
Mapped: America’s Fastest-Growing Major Cities
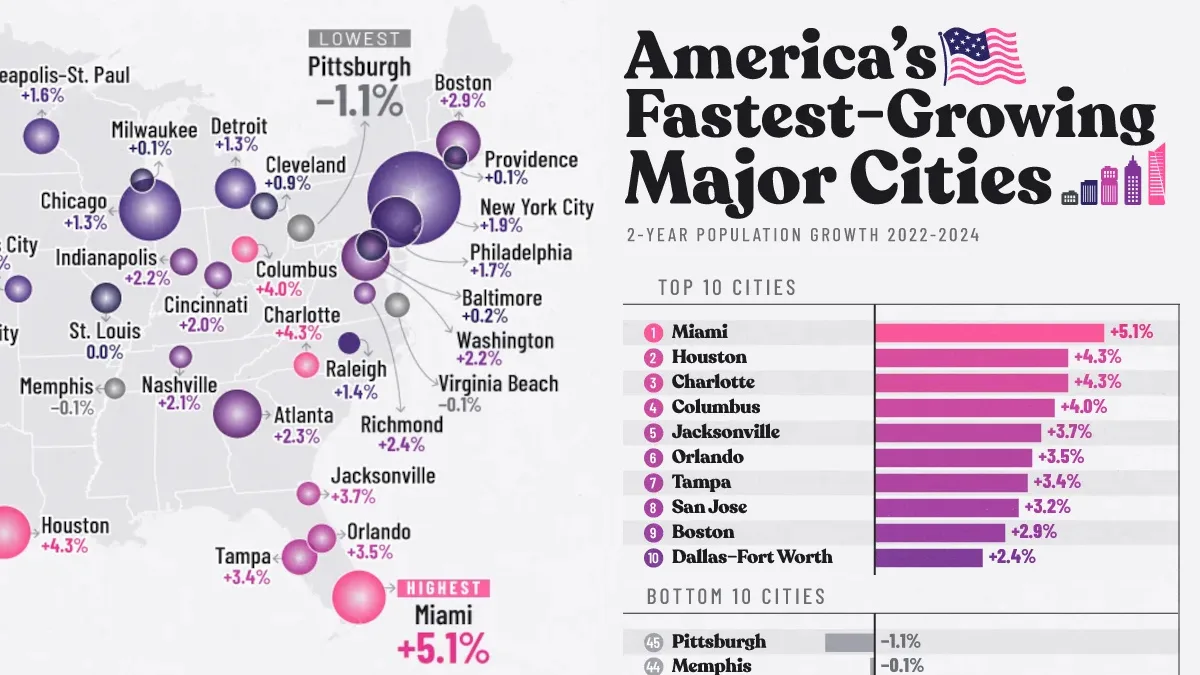
Explore the fastest-growing cities in America. Miami leads 45 major urban areas in population growth from 2022 to 2024.
Which Major U.S. Cities Are Growing the Fastest?
Key Takeaways
Miami recorded the fastest population growth among the 45 major U.S. urban areas analyzed, increasing 5.1% between 2022 and 2024.
Four Florida urban areas ranked among the seven fastest-growing, while Columbus, Ohio, placed fourth nationally.
Pittsburgh recorded the largest population decline, at 1.1%, while 42 of the 45 urban areas continued to grow.
America’s major cities are growing at very different speeds, with some adding residents rapidly while others have experienced population declines.
This visualization uses data from the U.S. Census Bureau’s American Community Survey to compare population growth between 2022 and 2024 across 45 urban areas with more than one million residents.
Unlike city-proper populations, urban areas include continuously developed communities that can extend across municipal boundaries.
Miami Leads America’s Fastest-Growing Urban Areas
The table below ranks the 45 major U.S. urban areas by population growth between 2022 and 2024.
RankCityGrowth
1Miami5.10%
2Houston4.31%
3Charlotte4.26%
4Columbus3.97%
5Jacksonville3.68%
6Orlando3.48%
7Tampa3.37%
8San Jose3.17%
9Boston2.89%
10Dallas–Fort Worth2.36%
11Richmond2.35%
12Atlanta2.29%
13Las Vegas2.27%
14Seattle2.26%
15Washington2.23%
16Indianapolis2.17%
17Nashville-Davidson2.06%
18Cincinnati2.01%
19Oklahoma City1.90%
20New York City1.90%
21San Antonio1.84%
22Austin1.79%
23Philadelphia1.74%
24San Francisco–Oakland1.57%
25Minneapolis–St. Paul1.57%
26Kansas City1.50%
27Phoenix1.40%
28Raleigh1.37%
29Chicago1.32%
30Detroit1.28%
31Denver1.02%
32Portland0.92%
33Cleveland0.91%
34Sacramento0.91%
35Salt Lake City0.78%
36San Diego0.59%
37Los Angeles0.52%
38Baltimore0.23%
39Providence0.14%
40Milwaukee0.06%
41Riverside0.01%
42St. Louis-0.05%
43Virginia Beach-0.08%
44Memphis-0.08%
45Pittsburgh-1.11%
Miami leads with 5.1% growth, followed by Houston and Charlotte at approximately 4.3% each. Columbus ranks fourth at 4.0%, ahead of several major Sun Belt destinations, including Jacksonville, Orlando, and Tampa.
International migration offers important context for Miami’s growth. According to the U.S. Census Bureau, Miami-Dade County recorded the country’s largest gain from international migration between 2022 and 2023, adding 54,457 residents from abroad.
However, the county also lost residents to other parts of the U.S. during that period, highlighting the importance of international migration to its population trends.
How Big Are America’s Major Urban Areas?
Population growth rates tell only part of the story. A smaller urban area can grow faster in percentage terms, while a larger one can add more residents despite a slower growth rate.
The table below shows the populations of America’s 45 major urban areas in 2024, providing context for the growth rates shown on the map.
RankUrban AreaPopulationGrowth
1New York City19,268,3881.9%
2Los Angeles11,984,0830.5%
3Chicago8,609,5711.3%
4Miami6,391,6705.1%
5Houston6,227,6664.3%
6Dallas–Fort Worth5,968,3222.4%
7Philadelphia5,782,6531.7%
8Atlanta5,298,7882.3%
9Washington5,230,3702.2%
10Boston4,453,3522.9%
11Phoenix4,121,1031.4%
12Detroit3,773,7251.3%
13Seattle3,642,0062.3%
14San Francisco–Oakland3,417,7361.6%
15San Diego3,064,4350.6%
16Tampa2,957,5313.4%
17Minneapolis–St. Paul2,937,8661.6%
18Denver2,714,7681.0%
19Riverside2,333,0400.0%
20Las Vegas2,299,1892.3%
21Baltimore2,201,6730.2%
22St. Louis2,129,9180.0%
23Portland2,115,1400.9%
24San Antonio2,096,3901.8%
25Sacramento1,975,4890.9%
26Orlando1,948,1553.5%
27Austin1,940,0391.8%
28San Jose1,827,6433.2%
29Indianapolis1,767,3212.2%
30Pittsburgh1,729,616-1.1%
31Cincinnati1,726,6422.0%
32Kansas City1,714,9101.5%
33Cleveland1,695,5550.9%
34Columbus1,635,0394.0%
35Charlotte1,488,2494.3%
36Virginia Beach1,441,893-0.1%
37Jacksonville1,335,7143.7%
38Providence1,292,0410.1%
39Milwaukee1,291,7520.1%
40Nashville-Davidson1,201,9622.1%
41Salt Lake City1,183,0030.8%
42Raleigh1,179,1181.4%
43Richmond1,098,4572.4%
44Memphis1,037,125-0.1%
45Oklahoma City1,017,8281.9%
New York remained America’s largest urban area in 2024, with approximately 19.3 million residents, nearly three times Miami’s population.
Miami’s growth is particularly notable given its size. With nearly 6.4 million residents, it was already the fourth-largest urban area in the country, making its 5.1% increase especially significant.
Growth Extends Beyond the Sun Belt
Florida dominates the top of the ranking, while Houston and Dallas–Fort Worth also place among the 10 fastest-growing urban areas.
However, growth extends beyond the South. San Jose and Boston recorded increases of 3.2% and 2.9%, respectively, showing that some major urban areas outside the Sun Belt also experienced substantial growth.
The Census Bureau has documented a broader rebound in metropolitan population growth following the pandemic, supported in part by rising international migration. Several large metro areas that lost population earlier in the decade returned to growth by 2024.
These regional differences could reshape where Americans live in the decades ahead. For a longer-term perspective, see our map of how America’s population is projected to shift by 2050.
Why Pittsburgh’s Population Is Declining
While Miami’s population grew by 5.1%, Pittsburgh moved in the opposite direction, declining 1.1% between 2022 and 2024. That represents a 6.2-percentage-point gap between the fastest-growing and fastest-shrinking major urban areas.
Only three of the 45 urban areas recorded population declines, with Memphis and Virginia Beach each shrinking by approximately 0.1%.
A 2026 University of Pittsburgh analysis found that the wider Pittsburgh metropolitan region has experienced persistent population losses, largely because deaths have outnumbered births.
The study also found that relatively low international migration has not been enough to offset those losses. This provides context for Pittsburgh’s position at the bottom of the urban-area ranking, although the study covers a larger geographic area.
Learn More on the Voronoi App
If you enjoyed this visualization, check out Projected Population Change by Country (2025-2050) on the Voronoi app.
Related articles
Ranked: Countries That Owe the Most Money to the IMF
Argentina used to be richer than Europe and has not faced war in decades. Today it owes more to the IMF than any other country.
Charted: The Three Waves of the U.S. Trade Deficit (1990–2026)
The U.S. trade deficit in semiconductors and AI hardware hit an annualized $546 billion in Q2 2026, overtaking machinery and oil's 2008 peak.
Mapped: Unemployment Rates in Every U.S. State in 2026
The U.S. has nearly four percent unemployment in 2026. West Coast states like California drive up the national average.
Ranked: 125 European Cities by Quality of Life and Cost
Which European cities offer the best quality of life for the lowest cost? Explore 125 cities ranked by affordability and livability.
Mapped: What a Home Is Worth in Every U.S. State in 2026
A typical home in Hawaii is worth $833,000, more than four times one in West Virginia. See how home values compare in every U.S. state.
How New York Property Prices Compare Around the World
How expensive is New York real estate? See how much property the same money buys in 65 other cities worldwide.