
Mapped: The Economies Most Dependent on U.S. Trade
Trade with the U.S. equals 48% of Mexico's GDP and 44% of Vietnam's, more than six times the global average. See where your country ranks.
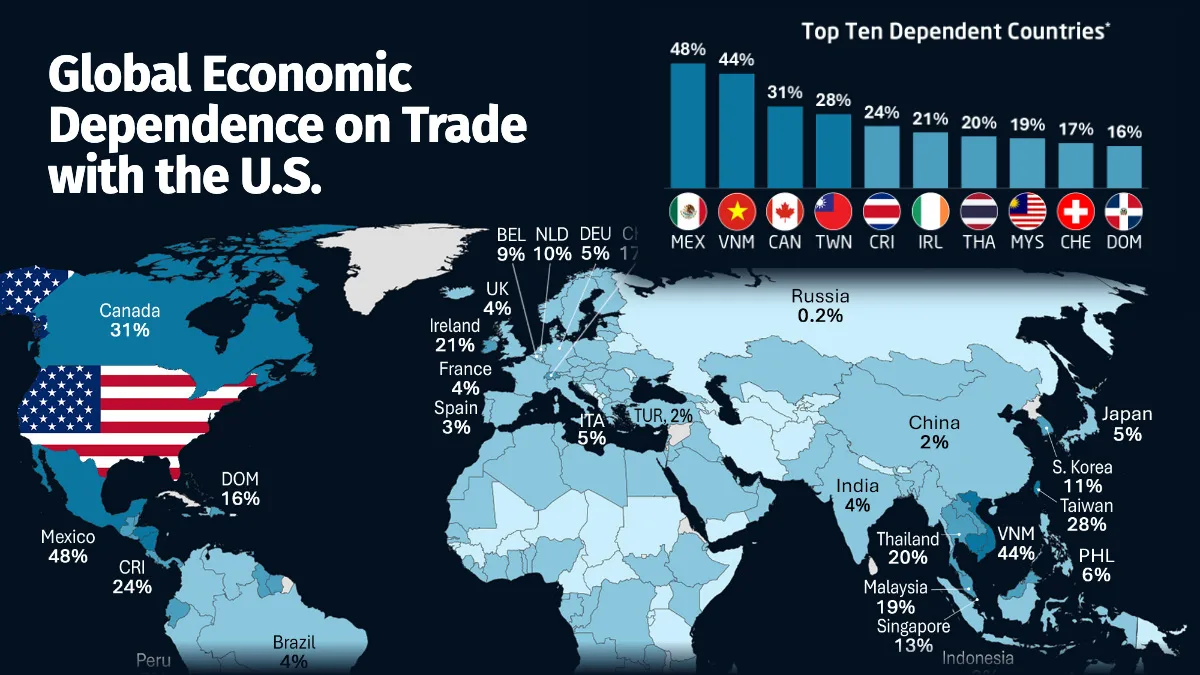
Which Economies Rely Most on U.S. Trade?
Key Takeaways
Trade with the U.S. is equivalent to 48% of Mexico’s GDP and 44% of Vietnam’s in 2025, more than six times the global average of 6.5%.
Canada has the third-highest exposure among large economies with GDP above $100 billion, with U.S. trade equal to 31% of its GDP.
China, one of America’s largest trading partners, has U.S. trade equal to just 2% of its GDP.
When U.S. trade policy shifts, some economies barely notice. For others, trade with the U.S. is large enough to noticeably influence economic growth.
The differences are striking: some major economies have deep trade ties to the U.S., while others are far less exposed relative to the size of their economies.
This graphic maps each country’s goods trade with the U.S. (exports plus imports) as a share of GDP in 2025, using data from the U.S. Census Bureau, the U.S. International Trade Commission, the World Trade Organization, and the IMF.
Why Vietnam Ranks Nearly as High as Mexico
Vietnam’s economy runs on trade: its exports and imports together were worth 190% of its GDP in 2025.
The U.S. is Vietnam’s largest export market, and bilateral trade equals 44% of Vietnam’s GDP, second only to Mexico among large economies.
The table below ranks the 25 economies with GDP above $100 billion where trade with the U.S. is largest relative to GDP:
RankCountry (GDP over $100B)Trade With the U.S. (% of GDP)
1 Mexico47.8
2 Vietnam43.9
3 Canada31.3
4 Taiwan28.2
5 Costa Rica23.7
6 Ireland21.3
7 Thailand19.7
8 Malaysia19.0
9 Switzerland17.3
10 Dominican Republic16.2
11 Ecuador13.9
12 Singapore13.3
13 Guatemala12.9
14 Chile11.0
15 South Korea10.6
16 Netherlands9.7
17 Hong Kong9.1
18 Belgium8.8
19 Colombia8.3
20 Venezuela6.9
21 United Arab Emirates6.9
22 Peru6.9
23 Hungary6.2
24 Israel5.7
25 Philippines5.6
Goods trade with the U.S. (exports plus imports) as a share of GDP in 2025. Includes economies with GDP of about $100 billion or more.
Vietnam’s exports to the U.S. rose 28.1% to more than $153 billion in 2025, led by computers and electronics amid American efforts to reduce supply chain dependence on China.
Taiwan, where goods trade with the U.S. equals 28% of GDP, saw exports to the U.S. rise 78% to $198.3 billion in 2025. Together with Vietnam, Thailand (20%), and Malaysia (19%), four of the eight large economies most exposed to U.S. trade are major hubs in the supply chains behind the world’s electronics.
America’s Biggest Partners Are Often Less Exposed
Mexico and Canada are the only trillion-dollar economies in the top 10, with U.S. trade equal to 48% and 31% of GDP, respectively. For Canada, energy is a major part of that relationship: 90.1% of its crude oil exports went to the U.S. in 2025.
Across economies of all sizes, several smaller countries rank even higher. Nicaragua (34%), Cambodia (34%), and Honduras (32%) all rank above Canada, as apparel and assembly industries tie them closely to U.S. demand.
The full dataset below ranks every economy with available data, including smaller ones:
RankCountryTrade With the U.S. (% of GDP)
1 Mexico47.8
2 Vietnam43.9
3 Nicaragua33.9
4 Cambodia33.6
5 Honduras32.0
6 Canada31.3
7 Taiwan28.2
8 Guyana25.0
9 Costa Rica23.7
10 Trinidad and Tobago22.9
11 Ireland21.3
12 Thailand19.7
13 Malaysia19.0
14 El Salvador18.7
15 Switzerland17.3
16 Dominican Republic16.2
17 Aruba14.6
18 Grenada14.6
19 Ecuador13.9
20 Jamaica13.6
21 Singapore13.3
22 Saint Vincent and the Grenadines12.9
23 Guatemala12.9
24 Laos12.3
25 Suriname12.2
26 Chile11.0
27 Panama10.6
28 South Korea10.6
29 Paraguay10.2
30 Micronesia9.8
31 Netherlands9.7
32 Dominica9.2
33 Hong Kong9.1
34 Belgium8.8
35 Jordan8.8
36 Barbados8.7
37 Colombia8.3
38 Palau7.2
39 Venezuela6.9
40 United Arab Emirates6.9
41 Peru6.9
42 Fiji6.8
43 Hungary6.2
44 Lesotho6.2
45 Georgia5.9
46 Haiti5.8
47 Israel5.7
48 Philippines5.6
49 Bahrain5.5
50 South Africa5.4
51 Japan5.2
52 Slovakia5.0
53 Libya4.9
54 Lithuania4.8
55 Germany4.8
56 Iceland4.7
57 Italy4.7
58 Samoa4.6
59 Djibouti4.6
60 Slovenia4.6
61 Uruguay4.2
62 Brazil4.2
63 Nigeria4.1
64 Morocco4.1
65 United Kingdom4.1
66 Austria4.1
67 Madagascar4.0
68 Vanuatu3.9
69 India3.9
70 Sweden3.8
71 Tuvalu3.8
72 New Zealand3.8
73 Denmark3.7
74 Malta3.6
75 Gabon3.6
76 France3.6
77 Finland3.5
78 Liberia3.5
79 Australia3.4
80 Egypt3.4
81 Czechia3.3
82 Indonesia3.3
83 Liechtenstein3.2
84 Oman3.2
85 Iraq3.1
86 Estonia3.1
87 Lebanon3.0
88 Qatar3.0
89 Tunisia2.8
90 Togo2.8
91 Poland2.8
92 Argentina2.7
93 Gambia2.7
94 Tonga2.7
95 Bangladesh2.7
96 Namibia2.7
97 Portugal2.7
98 Côte d'Ivoire2.7
99 Spain2.6
100 Kuwait2.5
101 Latvia2.5
102 Turkey2.4
103 Democratic Republic of the Congo2.3
104 Luxembourg2.3
105 Ethiopia2.3
106 China2.2
107 Ghana2.2
108 Sierra Leone2.2
109 Pakistan2.2
110 Norway2.2
111 North Macedonia2.0
112 Bulgaria2.0
113 Saudi Arabia2.0
114 Ukraine1.8
115 Senegal1.8
116 Republic of the Congo1.8
117 Greece1.7
118 San Marino1.7
119 Kazakhstan1.7
120 Timor-Leste1.7
121 Croatia1.6
122 Maldives1.6
123 Mauritius1.6
124 Benin1.5
125 Bolivia1.5
126 Equatorial Guinea1.5
127 Botswana1.5
128 Zambia1.5
129 Angola1.5
130 Cabo Verde1.4
131 Mauritania1.4
132 São Tomé and Príncipe1.4
133 Kenya1.4
134 Eswatini (Swaziland)1.4
135 Brunei1.3
136 Mozambique1.3
137 Solomon Islands1.3
138 Romania1.3
139 Algeria1.3
140 Serbia1.2
141 Mongolia1.1
142 Myanmar (Burma)1.1
143 Kiribati1.1
144 Seychelles1.1
145 South Sudan1.0
146 Moldova0.9
147 Albania0.9
148 Kyrgyzstan0.9
149 Nauru0.8
150 Cameroon0.8
151 Guinea0.8
152 Uzbekistan0.7
153 Cyprus0.7
154 Armenia0.7
155 Azerbaijan0.7
156 Macau0.7
157 Yemen0.6
158 Bosnia and Herzegovina0.6
159 Montenegro0.6
160 Nepal0.5
161 Rwanda0.5
162 Tanzania0.5
163 Malawi0.5
164 Papua New Guinea0.5
165 Uganda0.5
166 Central African Republic0.5
167 Chad0.4
168 Somalia0.4
169 Kosovo0.4
170 Andorra0.3
171 Bhutan0.3
172 Guinea-Bissau0.3
173 Burkina Faso0.3
174 Afghanistan0.2
175 Zimbabwe0.2
176 Tajikistan0.2
177 Turkmenistan0.2
178 Comoros0.2
179 Burundi0.2
180 Russia0.2
181 Mali0.1
182 Sudan0.1
183 Niger0.1
184 Belarus0.0
185 Iran0.0
186 Puerto Rico0.0
-- Global Average6.5
Goods trade with the U.S. (exports plus imports) as a share of GDP in 2025.
China sits at just 2%, about one-third of the global average. Despite the enormous value of U.S.-China trade, it is relatively small compared with China’s $19.6 trillion economy and its trade with the rest of the world. Germany and Japan, two other major economies, are both at 5%.
Switzerland (17%) is Europe’s most exposed economy after Ireland (21%). That exposure became costly in 2025, when the U.S. imposed a 39% tariff on many Swiss exports from August to November before a framework deal reduced it to 15%.
Learn More on the Voronoi App
If you enjoyed today’s post, check out The Export Dependency of Major Economies on Voronoi.
Related articles
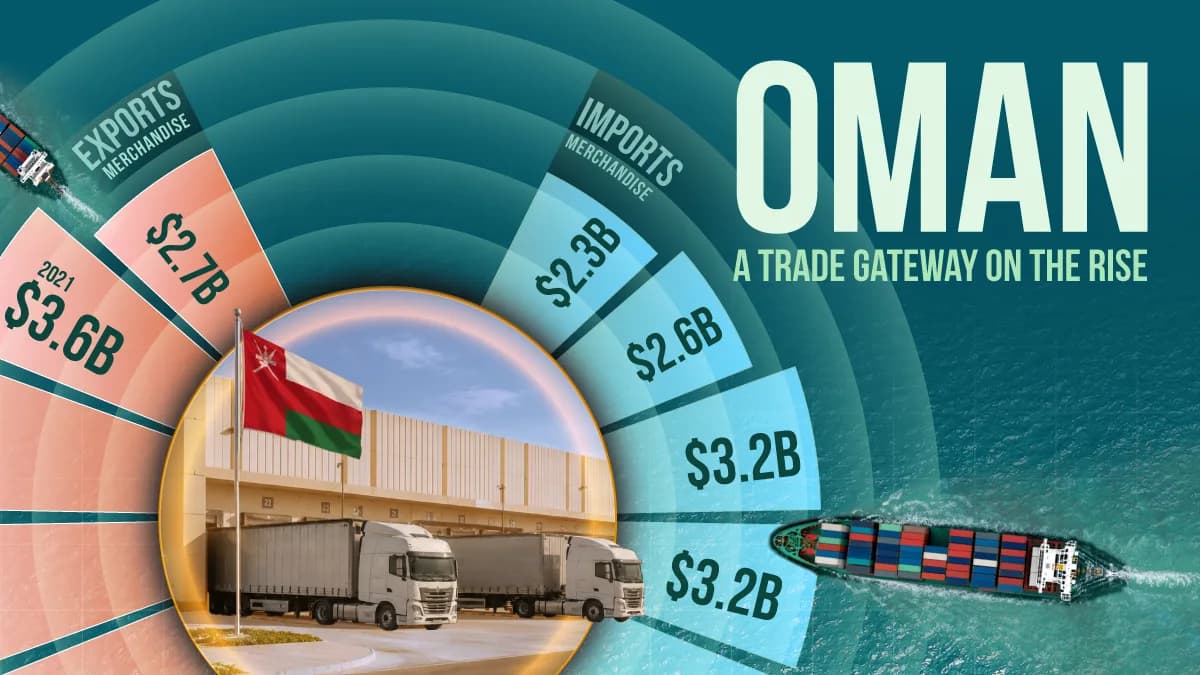
Oman: A Trade Gateway on the Rise
How much did Oman’s exports and imports grow from 2020 to 2025? Explore the data behind this rising trade gateway.
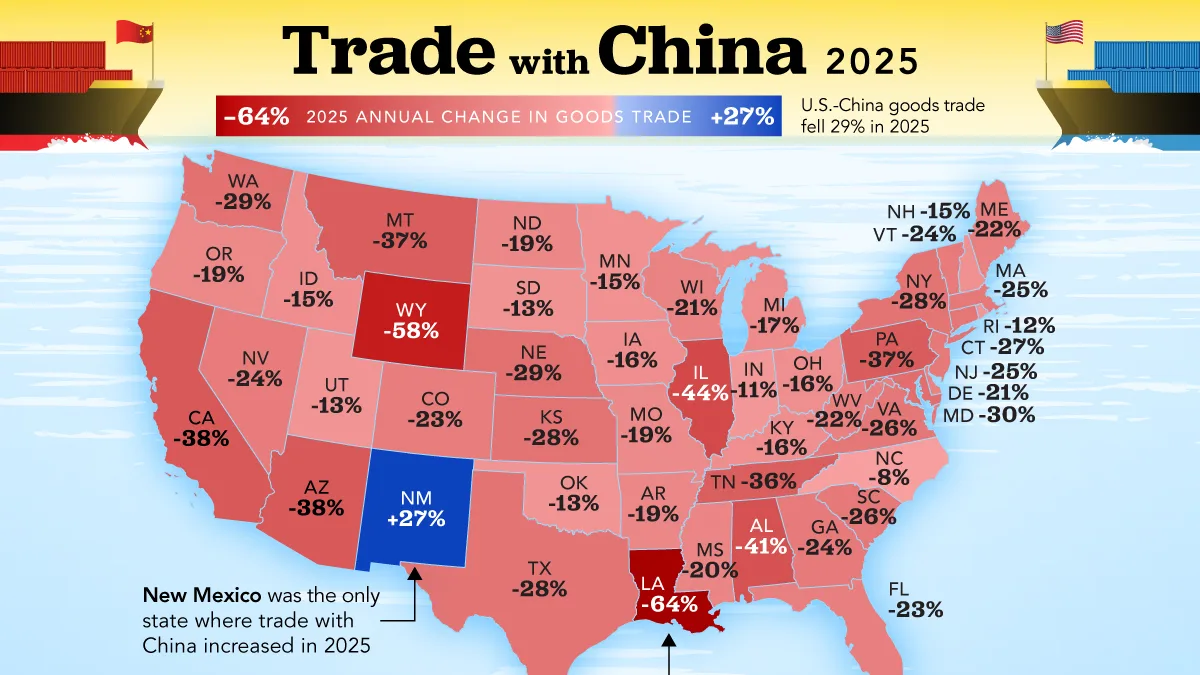
Mapped: How U.S.-China Trade Changed by U.S. State
Trade with China fell in 49 of 50 U.S. states in 2025. Only New Mexico grew, lifted by a surge in electronics exports.
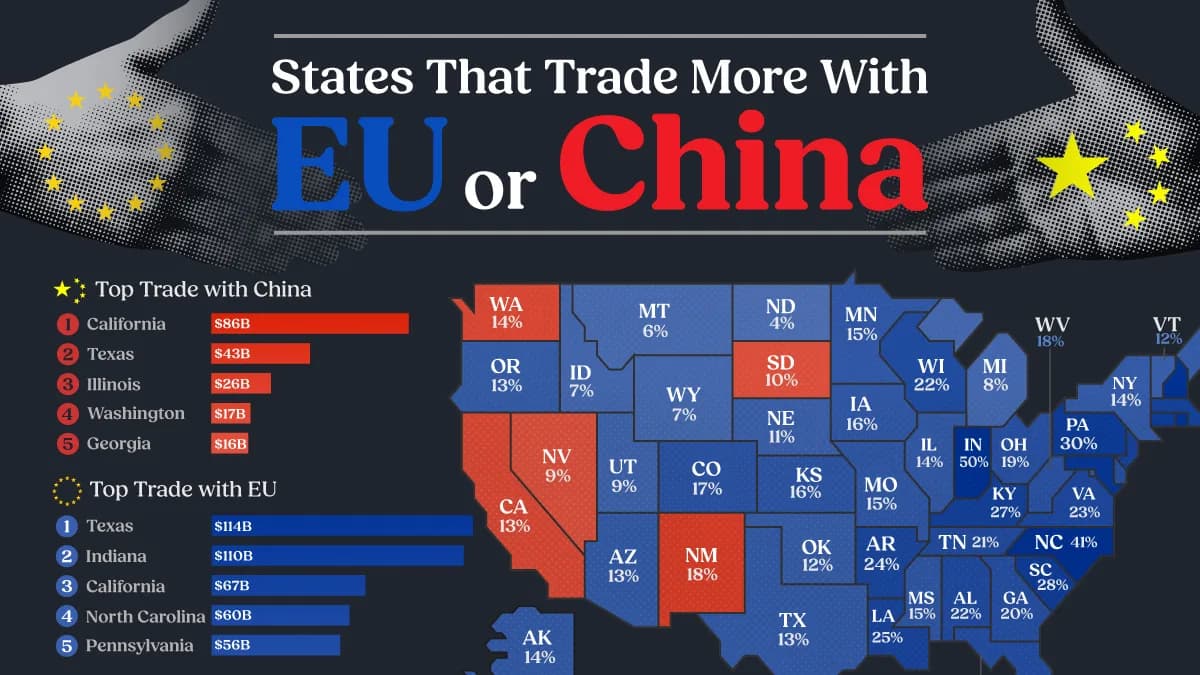
Mapped: Does Your State Trade More With China or the EU?
The European Union has emerged as an unexpected beneficiary of rising trade tensions between the U.S. and China.
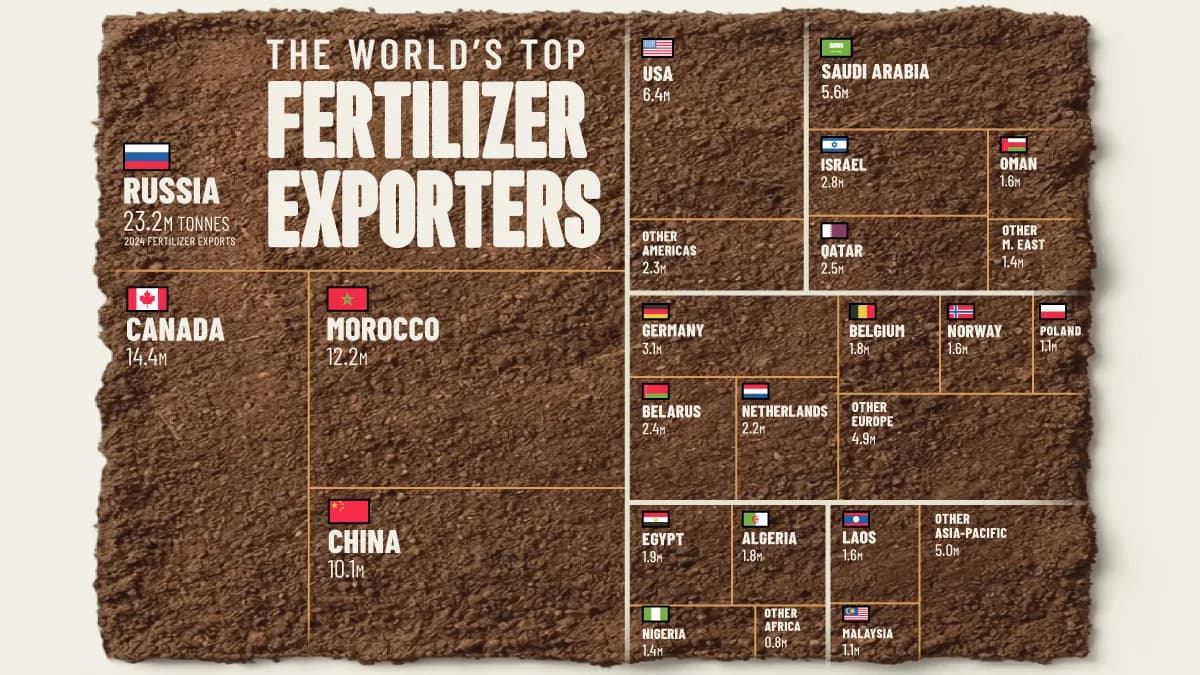
Ranked: The Countries That Dominate the Fertilizer Trade
Global agriculture depends on three main fertilizers. Four countries are responsible for over half of all fertilizer exports.
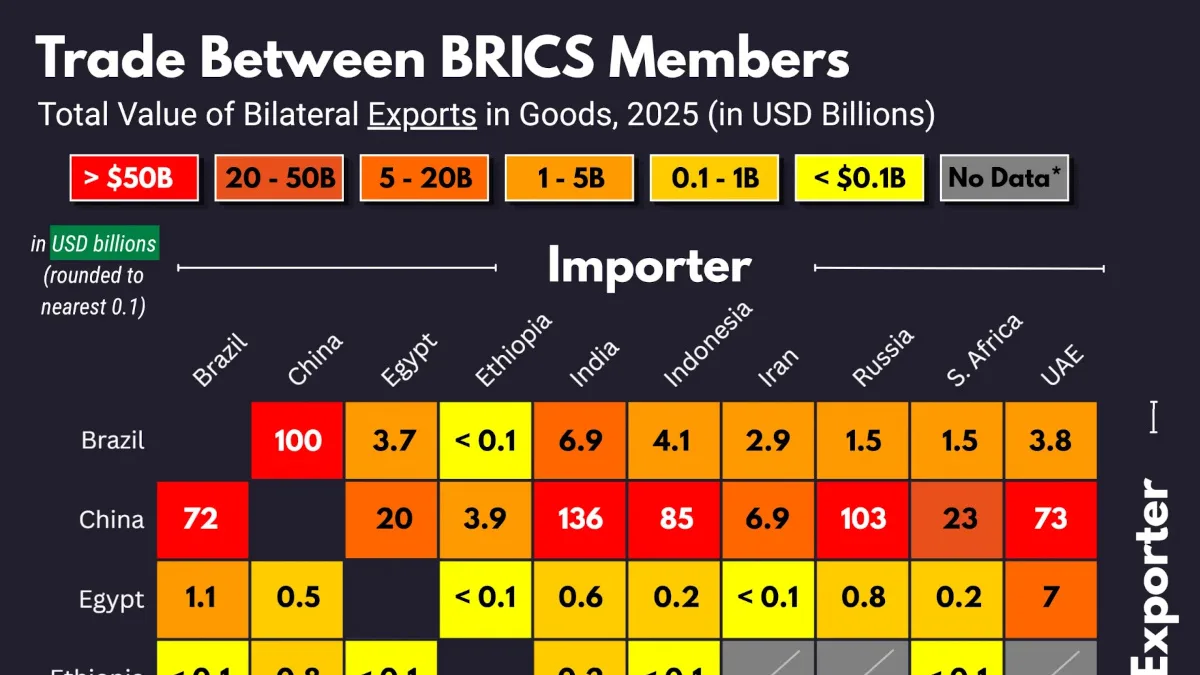
Which BRICS Countries Trade the Most With Each Other?
Which BRICS countries trade the most with each other? This chart maps bilateral exports across the 10-member group.