Ranked: America’s Energy Production by Source in 2026
Which energy source leads America’s production in 2026—and what does it mean for manufacturers choosing where to build?
Published
November 5, 2026 8:28 am
By
The following content is sponsored by Shale Crescent USA
Save to Inbox
×
Save to Inbox
Sign me up for the free Visual Capitalist daily newsletter.
Send
Inside America’s 2026 Energy Mix
Key Takeaways
Natural gas and natural gas plant liquids together account for 47.6% of U.S. primary energy production in the supplied 2026 YTD data.
Dry natural gas represents 80.6% of that combined category by energy content; natural gas plant liquids contribute 19.4%.
Ohio, West Virginia, and Pennsylvania anchor the country’s largest natural gas-producing region, making supply a consideration for energy-intensive operations.
Energy supply helps shape where businesses build and expand. For manufacturers, access to fuel and industrial feedstocks can influence long-term operating decisions.
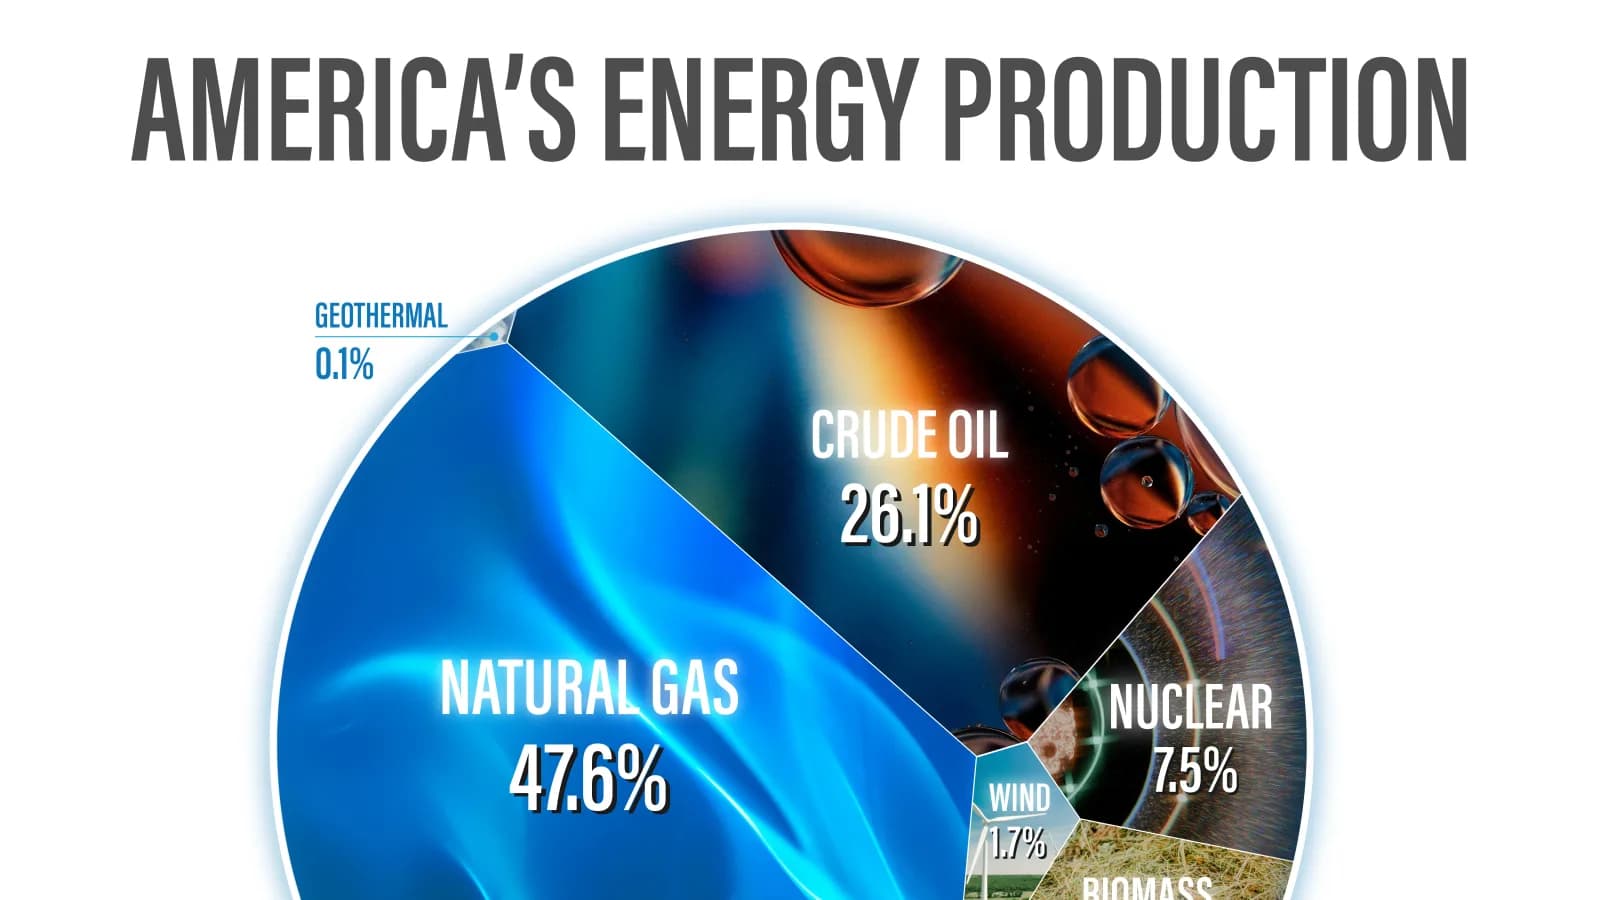
This graphic, in partnership with Shale Crescent USA, shows America’s energy production by source using data from the EIA. It covers 2026 year-to-date production, combining dry natural gas and natural gas plant liquids into one category.
Natural Gas Accounts for Nearly Half
Natural gas and natural gas plant liquids together account for 47.6% of U.S. primary energy production. By comparison, crude oil contributes 26.1%, while coal supplies 9.8%.
Here is a table that shows U.S. primary energy production by source in 2026 YTD.
Energy SourceProduction (Quadrillion Btu)Share of Total
Natural Gas21.4147.6%
Crude Oil11.7526.1%
Coal4.429.8%
Nuclear3.347.5%
Biomass2.164.8%
Wind0.771.7%
Solar0.651.5%
Hydroelectric0.420.9%
Geothermal0.050.1%
Total44.98100.0%
Figures cover January–June 2026. Natural Gas combines dry natural gas and natural gas plant liquids.
Natural gas overall contributes 21.41 quadrillion British thermal units (Btu), against total production of 44.98 quadrillion Btu.
The gas category and crude oil represent nearly three-quarters of total production. These figures measure primary energy production, not electricity generation.
In the combined natural gas category, dry natural gas contributes 80.6% by energy content. Natural Gas Plant liquids account for the remaining 19.4%.
Meanwhile, natural gas also heats homes and provides essential industrial feedstocks.
A Natural Advantage for Manufacturing and Power Generation
Ohio, West Virginia, and Pennsylvania form the country’s largest natural gas-producing region. Consequently, the Shale Crescent’s industrial appeal starts with its proximity to abundant domestic supply.
For energy-intensive operations evaluating new locations, proximity to that supply offers a reason to consider the region. In addition, chemical producers can assess access to both fuel and feedstocks when comparing sites.
However, abundant production alone does not determine a facility’s delivered energy costs. Companies should evaluate pipeline access, utility connections, and contract terms alongside supply.
Ultimately, natural gas’s scale reinforces the Shale Crescent’s relevance to and security of supply for energy-intensive businesses. It makes local energy supply an important consideration when planning the next investment.
You may also like
- Energy2 weeks ago The World’s Natural Gas Prices Over Time (2006–2026) Compare natural gas prices across U.S., European, and Asian benchmarks and explore the Shale Crescent’s industrial cost advantage.
- Energy2 months ago Ranked: U.S. Natural Gas vs. Countries See how U.S. natural gas production regions compare with leading countries worldwide.
- Energy3 months ago Mapped: Where is U.S. Natural Gas Produced? U.S. regional natural gas production in 2026 shows Appalachia leading the nation, reinforcing the Shale Crescent’s industrial edge.
- Energy1 year ago The Future of U.S. Natural Gas Production, by Region EIA projections show the East—powered by the Shale Crescent—leading U.S. natural gas through 2050. Here’s how this shift can translate into a lasting manufacturing cost advantage.
- Energy1 year ago Ranked: The Lowest Cost Energy Sources Shale Crescent USA’s natural gas ranks as the lowest cost energy on a $/BOE basis—outpacing NYMEX, coal, oil, and imported LNG—and offers a manufacturing edge.
- Energy1 year ago Who is Growing? U.S. Natural Gas Leaders Which U.S. regions lead natural gas production growth? See why the Shale Crescent is now fueling millions more homes and factories.
- Energy1 year ago Visualized: Where is the Most Natural Gas Production? See how natural gas production stacks up globally and why the Shale Crescent ranks third—a strategic edge for U.S. manufacturing.
- Energy1 year ago Shale Crescent USA: A World-Class Manufacturing Region Shale Crescent USA brings energy, customers, and infrastructure together in one region, helping manufacturers reduce costs as reshoring accelerates.
Subscribe
Source: https://www.visualcapitalist.com/sp/sc02-americas-energy-production-by-source-in-2026/
Get the latest news delivered to your inbox.
Related articles