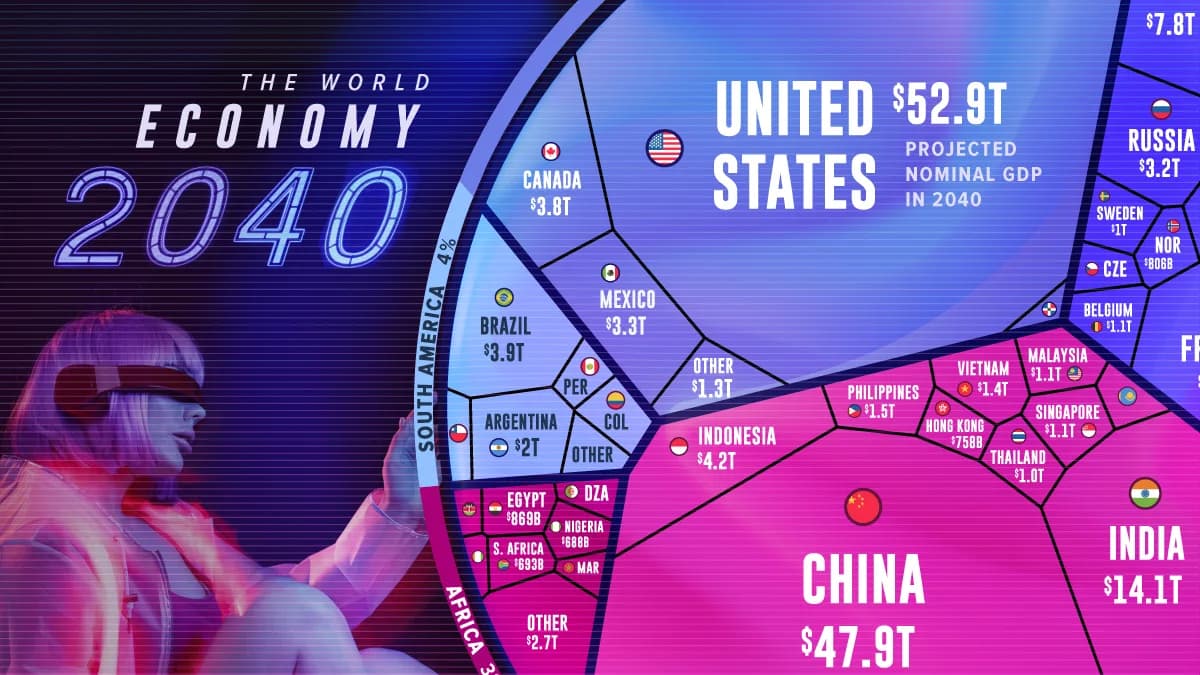
The World Economy in 2040, in One Chart
The U.S., China, and India are projected to generate half of world GDP in 2040, while Indonesia climbs into the top ten.
How the World Economy Could Look in 2040
Key Takeaways
The United States, China, and India are projected to account for 51% of the world’s $227 trillion in economic output in 2040.
India is projected to rise from fourth place in 2026 to third in 2040, while Indonesia climbs into the top 10, overtaking Italy.
The global economy is projected to grow from approximately $124 trillion in 2026 to $227 trillion by 2040, an increase of 83% in nominal terms.
That expansion will reshape the economic rankings, with China projected to narrow America’s lead and Asia accounting for a growing share of global output.
This graphic shows projected GDP across 190 economies in 2040, using the World Economic League Table 2026 produced by the Centre for Economics and Business Research (Cebr). Figures measure annual output in current U.S. dollars and are not adjusted for inflation.
China to Close In on U.S. GDP by 2040
In Cebr’s estimates for 2026, the U.S. economy accounts for about 26% of global GDP at $31.6 trillion, while China accounts for 17% at $20.9 trillion.
By 2040, the gap between the world’s two largest economies is projected to narrow to approximately $5 trillion, compared with $10.7 trillion in 2026. The U.S. would remain in first place at $52.9 trillion, followed by China at $47.9 trillion.
China’s share of global GDP is projected to rise to 21%, while America’s falls to 23%. According to IMF data, China already ranks as the world’s largest economy by purchasing power parity in 2026, which accounts for differences in local prices.
The table below lists each economy’s projected nominal GDP in 2040, in billions of U.S. dollars, and its projected share of the global economy:
RankCountry / Economy2040 GDP Proj. ($B) Share of Global GDP (%)
1 United States52,85223.3
2 China47,87721.1
3 India14,0926.2
4 Germany7,7833.4
5 United Kingdom6,7843.0
6 Japan5,9222.6
7 France5,2032.3
8 Indonesia4,1821.8
9 Brazil3,9431.7
10 Canada3,8181.7
11 Italy3,7711.7
12 Spain3,3731.5
13 South Korea3,2971.5
14 Australia3,2891.4
15 Mexico3,2681.4
16 Russia3,2471.4
17 Saudi Arabia2,8901.3
18 Netherlands2,1420.9
19 Türkiye2,0530.9
20 Argentina2,0090.9
21 Poland1,8280.8
22 Switzerland1,6390.7
23 Taiwan1,5210.7
24 Philippines1,5000.7
25 Bangladesh1,4480.6
26 United Arab Emirates1,4120.6
27 Vietnam1,4070.6
28 Ireland1,2340.5
29 Belgium1,1060.5
30 Israel1,0630.5
31 Malaysia1,0600.5
32 Singapore1,0580.5
33 Thailand1,0370.5
34 Sweden1,0190.4
35 Austria8940.4
36 Egypt8690.4
37 Colombia8270.4
38 Pakistan8120.4
39 Norway8060.4
40 Romania7640.3
41 Hong Kong7580.3
42 Denmark7510.3
43 Iraq6990.3
44 South Africa6930.3
45 Nigeria6880.3
46 Kazakhstan6500.3
47 Czechia6300.3
48 Chile5970.3
49 Iran5940.3
50 Portugal5880.3
51 Peru5720.3
52 Algeria5260.2
53 Finland5160.2
54 Qatar5000.2
55 Greece4840.2
56 New Zealand4760.2
57 Ethiopia4610.2
58 Ukraine4350.2
59 Hungary4130.2
60 Morocco3890.2
61 Dominican Republic3470.2
62 Kenya3430.2
63 Uzbekistan3420.2
64 Kuwait3220.1
65 Côte d'Ivoire3180.1
66 Slovakia2890.1
67 Tanzania2750.1
68 Guatemala2710.1
69 Oman2600.1
70 Ecuador2460.1
71 Costa Rica226<0.1
72 Bulgaria221<0.1
73 Panama218<0.1
74 Serbia213<0.1
75 Croatia209<0.1
76 Uganda202<0.1
77 Democratic Republic of the Congo202<0.1
78 Sri Lanka201<0.1
79 Ghana201<0.1
80 Puerto Rico198<0.1
81 Angola197<0.1
82 Lithuania193<0.1
83 Luxembourg179<0.1
84 Slovenia153<0.1
85 Azerbaijan152<0.1
86 Uruguay152<0.1
87 Cameroon141<0.1
88 Cambodia131<0.1
89 Turkmenistan127<0.1
90 Nepal119<0.1
91 Jordan115<0.1
92 Belarus113<0.1
93 Bahrain106<0.1
94 Macao105<0.1
95 Paraguay104<0.1
96 Latvia103<0.1
97 Georgia102<0.1
98 Libya97<0.1
99 Myanmar (2039 GDP)108<0.1
100 Estonia92<0.1
101 Senegal89<0.1
102 Honduras87<0.1
103 Sudan85<0.1
104 Tunisia85<0.1
105 Cyprus83<0.1
106 Guinea80<0.1
107 Zimbabwe74<0.1
108 El Salvador74<0.1
109 Bolivia70<0.1
110 Benin70<0.1
111 Armenia69<0.1
112 Zambia68<0.1
113 Papua New Guinea68<0.1
114 Mali67<0.1
115 Guyana67<0.1
116 Mongolia66<0.1
117 Malta66<0.1
118 Niger66<0.1
119 Iceland63<0.1
120 Albania62<0.1
121 Bosnia and Herzegovina62<0.1
122 Mozambique60<0.1
123 Burkina Faso60<0.1
124 Rwanda55<0.1
125 Kyrgyzstan54<0.1
126 Botswana50<0.1
127 Chad49<0.1
128 Trinidad and Tobago48<0.1
129 Madagascar47<0.1
130 Gabon44<0.1
131 Nicaragua42<0.1
132 Tajikistan39<0.1
133 Moldova39<0.1
134 Somalia37<0.1
135 Jamaica36<0.1
136 North Macedonia36<0.1
137 Brunei Darussalam34<0.1
138 Mauritius34<0.1
139 Republic of Congo33<0.1
140 Haiti32<0.1
141 Togo31<0.1
142 Namibia29<0.1
143 Kosovo28<0.1
144 Laos28<0.1
145 Bahamas27<0.1
146 Mauritania26<0.1
147 Yemen25<0.1
148 Equatorial Guinea22<0.1
149 Malawi21<0.1
150 Sierra Leone18<0.1
151 Montenegro18<0.1
152 Maldives17<0.1
153 Suriname15.7<0.1
154 Liberia14.1<0.1
155 Djibouti13.6<0.1
156 Barbados13<0.1
157 Fiji12.9<0.1
158 Burundi10.7<0.1
159 Eswatini10.6<0.1
160 Bhutan10.6<0.1
161 South Sudan7.8<0.1
162 Cabo Verde7.7<0.1
163 Aruba7.2<0.1
164 Andorra7.1<0.1
165 Central African Republic6.9<0.1
166 Gambia6.6<0.1
167 Belize5.7<0.1
168 Guinea-Bissau5.7<0.1
169 Seychelles5.1<0.1
170 Timor-Leste4.9<0.1
171 St. Lucia4.5<0.1
172 Antigua and Barbuda4.1<0.1
173 Lesotho3.8<0.1
174 Solomon Islands3.7<0.1
175 Comoros3.5<0.1
176 San Marino3.4<0.1
177 Grenada3<0.1
178 St. Vincent and the Grenadines2.4<0.1
179 Samoa2.3<0.1
180 Vanuatu2.2<0.1
181 St. Kitts and Nevis2.2<0.1
182 São Tomé and Príncipe1.7<0.1
183 Dominica1.4<0.1
184 Tonga0.9<0.1
185 Micronesia0.8<0.1
186 Palau0.7<0.1
187 Kiribati0.6<0.1
188 Marshall Islands0.6<0.1
189 Nauru0.3<0.1
190 Tuvalu0.1<0.1
--World Total227,060100.0%
China’s gains are part of a broader economic shift toward Asia, whose share of global GDP is projected to rise from about 32% in 2026 to 39% by 2040.
Europe’s share is projected to fall from 26% to 21% over the same period, while North America’s declines from 30% to 27%.
While the U.S. is projected to remain the largest individual economy, growth in China, India, and Indonesia would give Asia a larger role in shaping global demand and investment.
India and Indonesia Climb the Global Economic Rankings
India is projected to rise from fourth in 2026 to third in 2040. Its economy would more than triple from $4.5 trillion to $14.1 trillion over that period, exceeding the projected combined output of Germany ($7.8 trillion) and Japan ($5.9 trillion).
Cebr points to manufacturers diversifying supply chains away from China as an opportunity for India, citing Apple’s expansion of production there as an example.
Germany and Japan also lose ground in the rankings, slipping from third to fourth and fifth to sixth, respectively, by 2040. Both economies are projected to grow, but India overtakes Germany while the U.K. overtakes Japan.
Indonesia makes an even larger jump, moving from 17th to eighth. Its projected $4.2 trillion economy in 2040 would overtake Italy’s $3.8 trillion, pushing Italy out of the top 10.
Learn More on the Voronoi App
If you enjoyed today’s post, check out The $128 Trillion Global Economy in 2026 on Voronoi.
Get the latest news delivered to your inbox.
Related articles