
How Much You’ll Pay in Lifetime Income Taxes, by State
Californians and New Yorkers may face high taxes, but residents of one state can expect to pay over $100,000 more over their lifetimes.
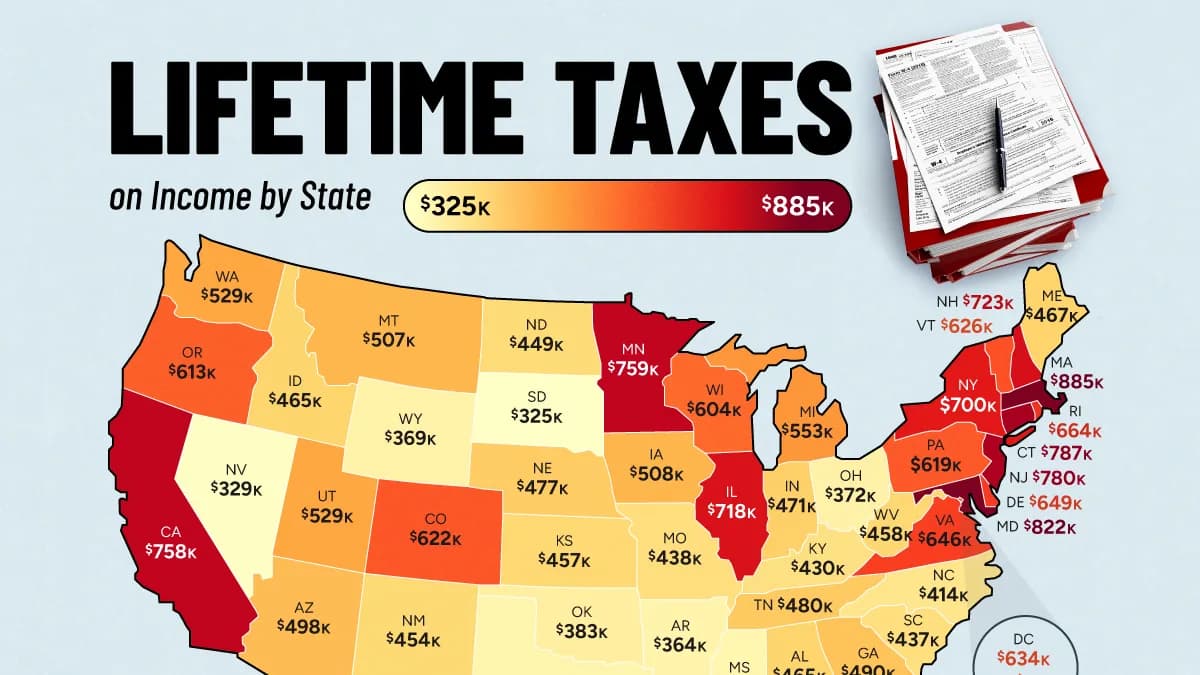
What Americans Pay in Lifetime Income Taxes
Key Takeaways
Estimated lifetime income taxes range from about $325,000 to $885,000 across the U.S.
Massachusetts has the highest estimate at $884,660, followed by Maryland and Connecticut.
South Dakota, Florida, and Nevada have the lowest estimates, at less than $330,000 each.
Over a 45-year career, the average worker could pay hundreds of thousands of dollars in federal and state income taxes, with the total varying substantially depending on where they live and how much they earn.
This map shows estimated lifetime federal and state income taxes across the U.S. based on a February 2026 analysis by Self Financial. The estimates assume a single filer works for 45 years, with each state’s earnings level and tax rates held constant.
Where Lifetime Taxes Are Highest
Massachusetts has the largest estimated lifetime income tax bill at $884,660, nearly triple South Dakota’s $324,568.
Six of the 10 highest estimates are in the Northeast. However, the pattern extends beyond the region: Minnesota’s modeled bill is almost identical to California’s, with both exceeding $750,000.
The table below ranks U.S. states by estimated lifetime income taxes for an average single filer.
RankStateAverage Lifetime Income Tax
1Massachusetts$884,660
2Maryland$822,386
3Connecticut$787,441
4New Jersey$779,557
5Minnesota$759,232
6California$758,078
7New Hampshire$723,243
8Illinois$718,059
9New York$699,611
10Rhode Island$664,200
11Delaware$649,157
12Virginia$645,502
13D.C.$633,600
14Vermont$626,106
15Colorado$621,665
16Pennsylvania$619,208
17Oregon$613,056
18Wisconsin$603,812
19Michigan$552,753
20Hawaii$538,578
21Utah$529,187
22Washington$529,082
23Alaska$510,154
24Iowa$507,869
25Montana$506,542
26Arizona$497,818
27Georgia$489,612
28Tennessee$480,189
29Nebraska$477,468
30Indiana$470,860
31Maine$467,213
32Idaho$464,705
33Alabama$464,542
34West Virginia$457,655
35Kansas$456,530
36New Mexico$453,670
37North Dakota$449,160
38Louisiana$445,660
39Missouri$437,891
40South Carolina$437,203
41Kentucky$430,132
42North Carolina$413,507
43Oklahoma$383,322
44Ohio$372,019
45Wyoming$369,227
46Arkansas$364,194
47Texas$360,267
48Mississippi$357,603
49Nevada$329,251
50Florida$325,598
51South Dakota$324,568
At the other end, South Dakota, Florida, and Nevada are the only three states with modeled lifetime income taxes below $330,000. All three have no individual state income tax.
Overall, 24 states exceed $500,000 in estimated lifetime income taxes. However, the ranking reflects differences in earnings as well as state tax policy, making these totals more than a simple comparison of tax rates.
The Big Paycheck Caveat
Higher lifetime taxes do not necessarily mean higher tax rates. Because federal income taxes are progressive, workers with higher earnings generally pay more federal income tax over their careers. Massachusetts, for example, has some of the highest wages nationwide.
The study assumes roughly $3 million in lifetime earnings for the average Massachusetts worker, compared with about $2 million in Florida. As a result, the gap between the two states does not represent what the same worker would necessarily save by moving from Massachusetts to Florida.
Massachusetts also illustrates why a lifetime dollar total differs from a tax-rate comparison. The state’s standard rate on taxable wages is 5%, while its higher 9% rate applies only above a $1 million annual income threshold.
The State Income Tax Divide
Neighboring states can take very different approaches to taxing earnings. Minnesota uses four income tax brackets, with rates ranging from 5.35% to 9.85%, while South Dakota imposes no personal income tax. That contrast adds another layer to the earnings differences behind their lifetime tax bills.
These differences are evolving as more states lower their rates. Eight states introduced individual income tax rate cuts in January 2026, while Ohio also switched from multiple brackets to a flat-rate system.
North Carolina, meanwhile, reduced its flat rate from 4.25% in 2025 to 3.99% in 2026. For someone with $50,000 in state taxable income, that translates into a $130 annual reduction before credits, a small yearly difference that could add up to nearly $6,000 across a 45-year working life.
Learn More on the Voronoi App
To see where federal tax dollars go, check out Breaking Down One U.S. Tax Dollar on Voronoi.
Source: https://www.visualcapitalist.com/mapped-how-much-youll-pay-in-taxes-in-your-life/
Related articles
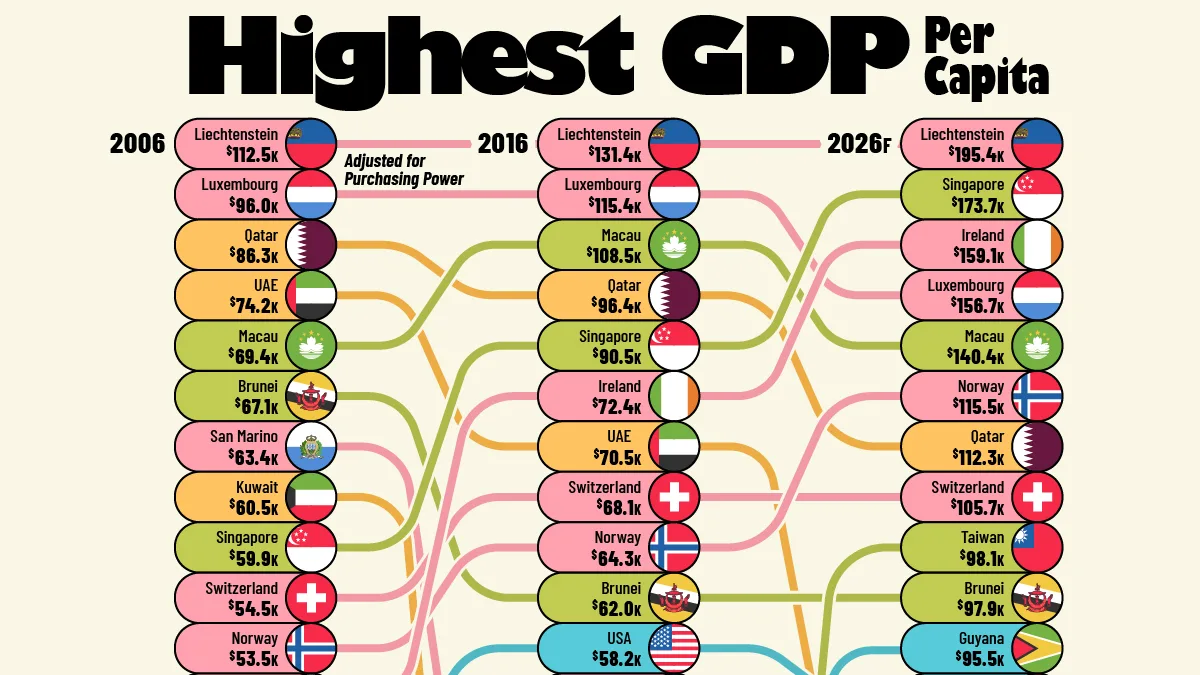
Ranked: The World’s Richest Countries (2006-2026)
European microstates are among the wealthiest countries worldwide. They face new competition from an emerging petrostate.
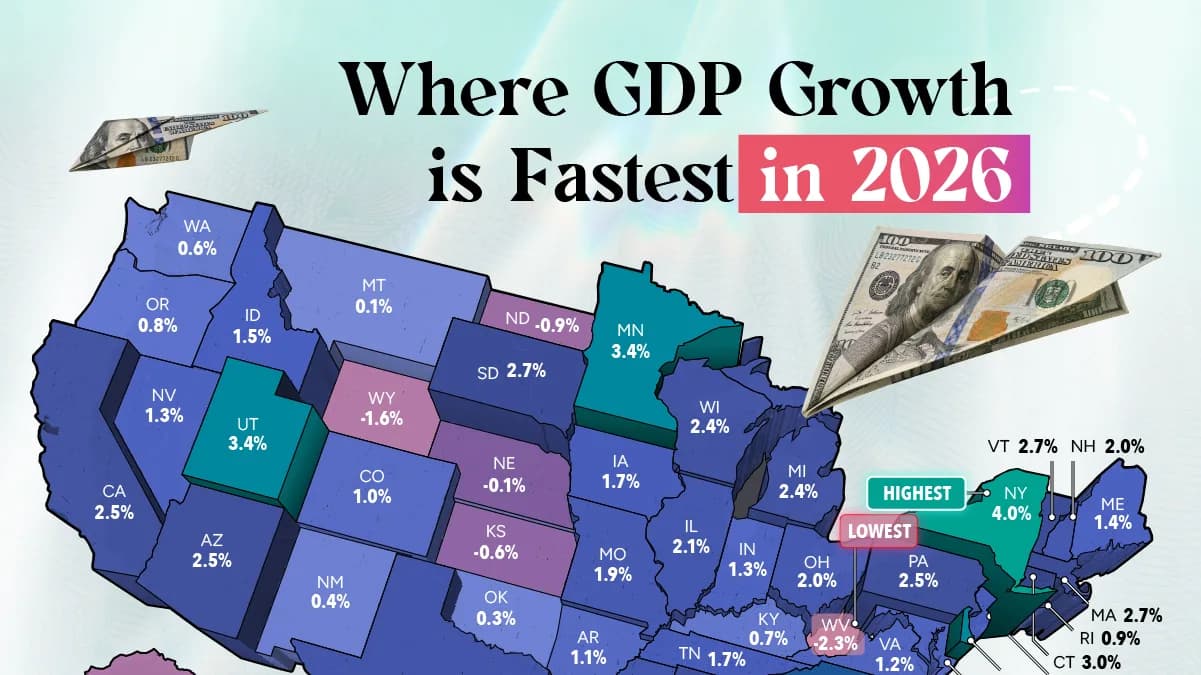
Mapped: U.S. States With the Fastest GDP Growth in 2026
U.S. GDP growth topped 2% in the second quarter. New data reveals which states grew much faster and which ones fell behind.
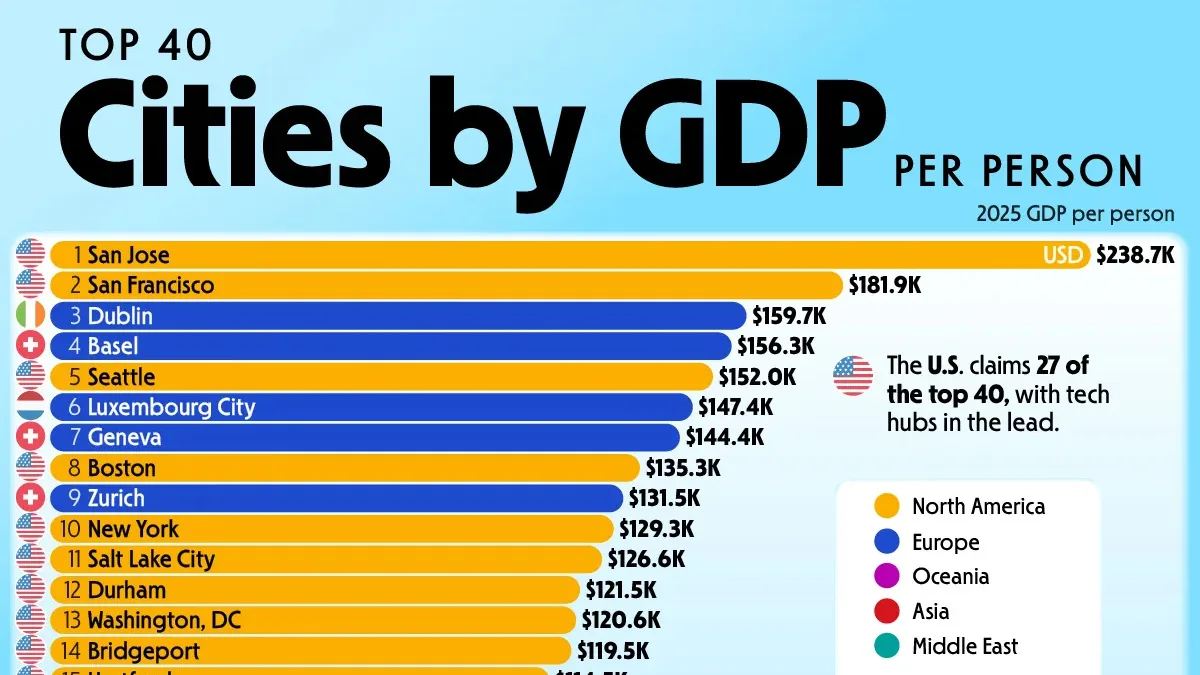
Ranked: The World’s 40 Richest Cities by GDP Per Person
The U.S. accounts for 27 of the 40 cities with the highest GDP per person, led by major technology hubs.
Ranked: Inflation vs. Consumer Confidence by Country
Argentina and Türkiye have among the highest inflation rates worldwide. No wonder both countries' citizens lack confidence in their finances.
Every U.S. State and Canadian Province by GDP Per Capita
See which U.S. states and Canadian provinces have the highest GDP per capita, led by Washington, D.C., New York, and Massachusetts.
Ranked: Where Are Ultra-Rich Populations Forecast to Grow the Fastest?
Global wealth is expanding beyond traditional hubs. Through 2031, Indonesia is forecast to see the fastest ultra-rich population growth.