
Mapped: The World’s Digital Leaders in 2026
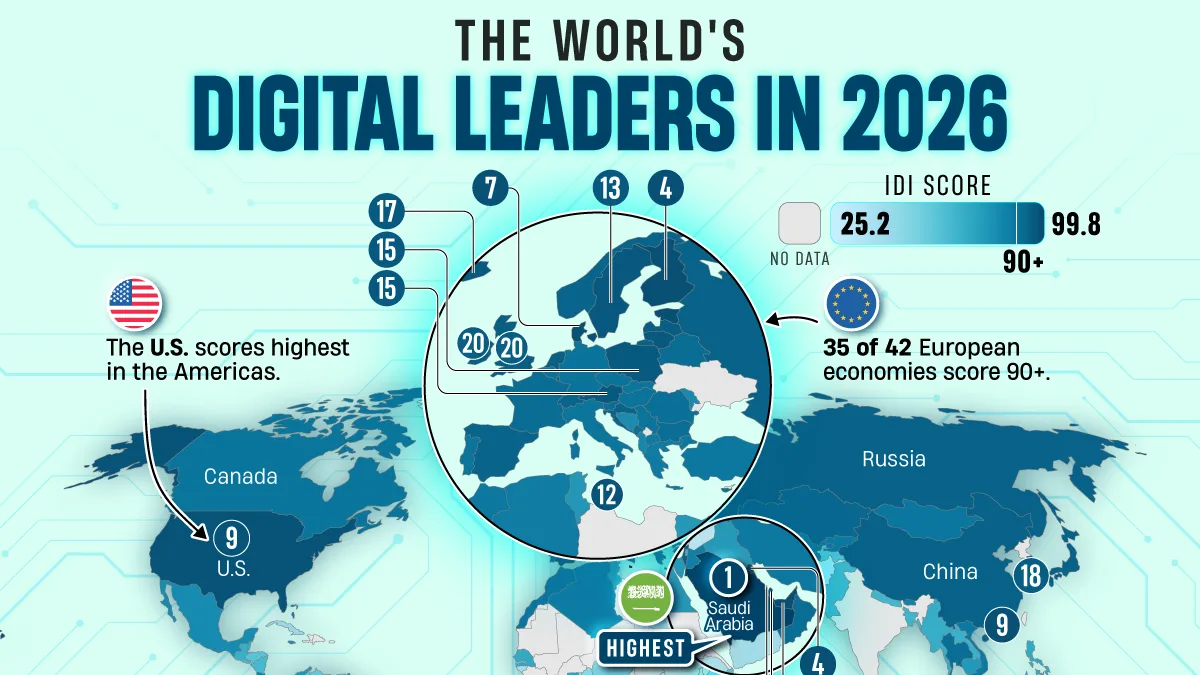
Which economies are the most digitally connected? See how 159 economies rank in the ITU’s 2026 ICT Development Index.
Which Economies Lead in Digital Connectivity?
Key Takeaways:
Saudi Arabia ranks first in the 2026 ICT Development Index, followed by the UAE.
Europe has consistently high connectivity, with 35 of 42 economies in the dataset scoring 90 or higher.
Large gaps remain within regions, particularly across Asia and the Pacific and the Arab States.
Digital connectivity now shapes everything from commerce and education to access to public services. Yet the ability to get online and make productive use of that connection still varies widely around the world.
This visualization maps 159 economies using the International Telecommunication Union’s ICT Development Index (IDI) for 2026. The report was published in June 2026, with its underlying indicators primarily reflecting 2024 data.
What Does the ICT Development Index Measure?
The IDI measures progress toward “universal and meaningful connectivity.” Its 10 indicators span two pillars: universal connectivity and meaningful connectivity. These include internet access and usage, network coverage, data consumption, and affordability.
The following table shows IDI scores for all 159 economies, based on ITU’s 2026 report.
EconomyIDI Score (2026)
Saudi Arabia99.8
United Arab Emirates98.8
Estonia98.5
Finland98.4
Kuwait98.4
Qatar98.4
Denmark98.2
Bahrain98.0
Hong Kong, China97.9
Singapore97.9
United States97.9
Malta97.4
Lithuania96.6
Sweden96.6
Austria96.4
Poland96.4
Iceland96.3
South Korea95.5
Latvia95.5
Ireland95.3
Malaysia95.3
United Kingdom95.3
Israel95.1
Australia94.9
Netherlands94.9
Macao, China94.7
Liechtenstein94.5
China94.4
Russian Federation94.4
Japan94.3
Croatia93.9
Norway93.9
Chile93.8
Spain93.8
Switzerland93.8
Brunei Darussalam93.6
Luxembourg93.3
Kazakhstan93.0
Monaco93.0
New Zealand92.2
Belarus92.0
France91.9
Uruguay91.9
Bulgaria91.6
Oman91.6
Slovenia91.6
Thailand91.6
Georgia91.5
Montenegro91.3
Andorra91.2
Romania91.1
Cyprus90.8
Czech Republic90.6
Belgium90.4
Germany90.4
Hungary90.4
Serbia90.3
Portugal90.1
Bahamas90.0
Canada89.9
Italy89.9
Slovakia89.6
Mongolia89.2
Morocco89.2
Mauritius89.1
Türkiye89.1
Iran89.0
Uzbekistan88.8
North Macedonia88.6
Kyrgyzstan88.4
Viet Nam88.4
Greece88.3
Algeria87.8
Armenia87.6
Jordan87.0
Bhutan86.4
South Africa86.4
Azerbaijan86.3
Costa Rica86.0
Albania85.0
Indonesia84.7
Brazil84.6
Seychelles84.4
Moldova84.1
Suriname83.7
Bosnia and Herzegovina83.5
Argentina83.4
Fiji83.3
Mexico83.3
Maldives83.1
Jamaica82.1
Peru81.2
Trinidad and Tobago80.3
Tunisia80.1
Panama80.0
Cabo Verde79.8
Egypt79.6
Colombia79.4
Iraq79.4
Dominican Rep.79.3
Paraguay79.0
Eswatini78.9
Cambodia78.7
Botswana77.7
Saint Vincent and the Grenadines76.5
Gabon76.2
Bolivia75.9
Ghana75.6
Belize73.9
Philippines73.6
Ecuador73.2
Sri Lanka73.2
Senegal72.8
Namibia72.2
Côte d'Ivoire72.0
Palestine*71.8
Myanmar71.6
Guatemala70.8
Kiribati70.8
Lao P.D.R.70.3
Bangladesh68.9
Nepal68.1
Pakistan67.7
El Salvador67.5
Nicaragua67.2
Djibouti65.5
Vanuatu64.8
Sao Tome and Principe62.9
Honduras62.8
Zimbabwe62.8
Tajikistan62.6
Kenya60.6
Venezuela59.8
Lesotho59.7
Gambia58.9
Tanzania57.2
Congo56.0
Nigeria55.8
Angola55.4
Rwanda55.3
Comoros54.3
Zambia53.5
Benin51.6
Yemen50.3
Togo49.5
Ethiopia48.1
Timor-Leste47.2
Cuba46.9
Syrian Arab Republic43.9
Papua New Guinea43.7
Guinea-Bissau42.4
Uganda40.3
Somalia37.2
Malawi36.5
Mozambique36.4
Afghanistan36.2
Madagascar34.5
Dem. Rep. of the Congo33.8
Burundi25.2
Beyond the Gulf, Estonia is Europe’s highest-ranked economy at 98.5, followed by Finland at 98.4. The U.S. ties for 9th overall at 97.9 and is the highest-scoring economy in the Americas, while Canada scores 89.9.
Gulf Economies Dominate the Top 10
Five of the 10 highest scores in the dataset belong to Middle Eastern economies: Saudi Arabia, the UAE, Kuwait, Qatar, and Bahrain. Saudi Arabia’s two IDI pillar scores are especially high, reaching 100 for universal connectivity and 99.6 for meaningful connectivity.
Across the wider Arab States region, however, the picture is much less uniform. ITU calculates a regional average of 78, with scores ranging from near the top of the scale to just 37. This shows how network availability, adoption, and affordability can differ substantially even among neighboring economies.
Asia’s Wide Digital Divide
Asia and the Pacific provide another striking contrast. Hong Kong and Singapore both score 97.9, while South Korea reaches 95.5 and Malaysia 95.3. Yet the ITU finds a 62-point gap between the region’s highest- and lowest-scoring economies.
Urbanization, infrastructure, and income all contribute to these differences. Previous ITU research found particularly large regional variations in internet use, mobile ownership, and broadband affordability. As digital commerce expands, these connectivity gaps can also affect participation in digital trade agreements and the wider digital economy.
At the same time, Asia is at the center of a global data center boom, as rising cloud adoption and AI workloads drive demand for digital infrastructure. Southeast Asian hubs such as Malaysia, Indonesia, and Thailand are attracting investment as operators expand beyond more established markets like Singapore.
Connectivity Is More Than Internet Access
Globally, the average IDI score is 79, with 59 economies scoring between 90 and 100 and 15 scoring below 50. Income remains closely associated with digital development: average scores range from 42 among low-income economies to 93 among high-income economies.
The index also has limits. It does not currently capture fixed-broadband penetration, internet speeds, digital skills, or online safety and security.
Even with those limitations, the broader trend is positive. Among the 151 economies included in both the 2023 and 2026 editions, 146 improved their IDI scores. As digital services become more embedded in work and public services, narrowing the remaining affordability and usage gaps will become increasingly important.
Learn More on the Voronoi App
To explore another dimension of the global digital economy, see Charting the World’s Top Digital Exporters on the Voronoi app.
Source: https://www.visualcapitalist.com/mapped-the-worlds-digital-leaders-in-2026/
Related articles

Breaking up (with Elon Musk) is hard to do
In a throwback to MySpace-style internet drama, Shivon Zilis announced that she and the father of four of her children, Elon Musk, had broken up on X.

OpenAI’s Dot agent is enterprise software that can also order your dinner
It's a tale as old as last week: OpenAI's new agent platform, called Dots, is full of cute little guys who can do your bidding.


Nacon’s new PS5 controller can mix audio from your phone and console
Nacon announced what the company is claiming is the world's first officially licensed PlayStation 5 controller with a built-in screen for adjusting settings like joystick sensitivity or remapping…

Beehiiv creators are buzzing about a new price increase
Beehiiv, a creator platform that has risen in popularity as an alternative to Substack, is increasing its prices - and many users aren't happy.