
Mapped: The World’s Most Innovative Countries in 2026
Switzerland leads the world’s most innovative economies in 2026, as Europe dominates the top 25 and Asia gains ground.
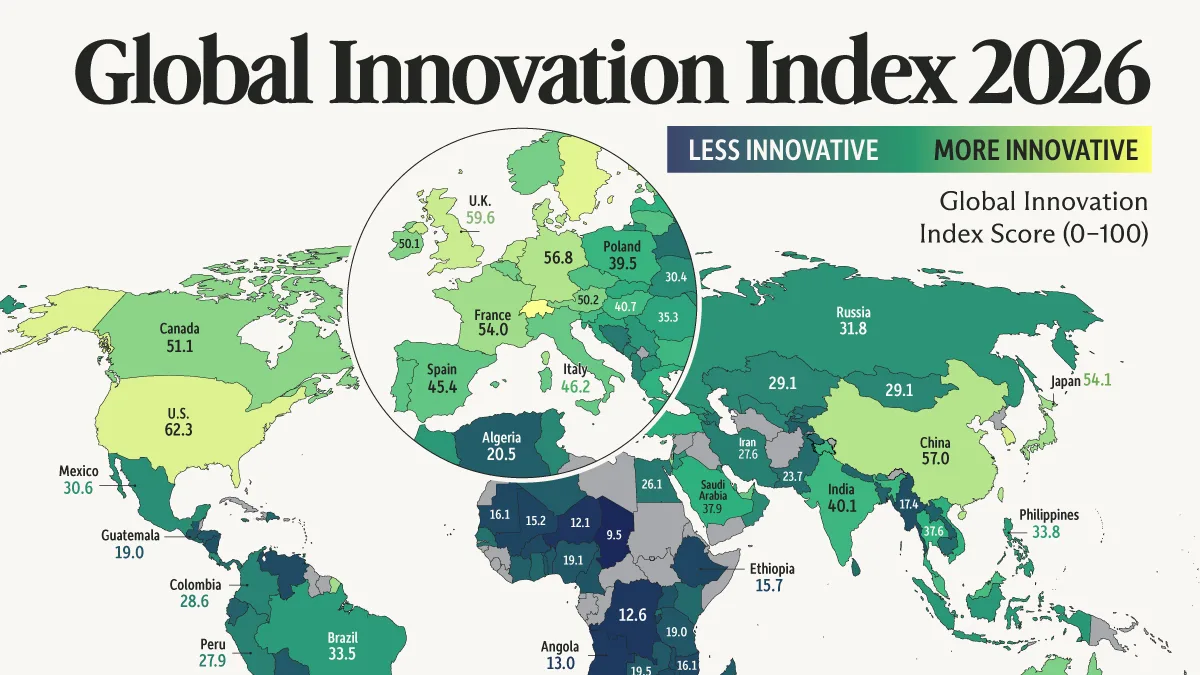
Which Countries Are the World’s Most Innovative in 2026?
Key Takeaways:
Switzerland ranks as the world’s most innovative economy in 2026, followed by Sweden and the United States.
Europe accounts for 14 of the top 25 economies, while China is the only upper-middle-income economy in the top 30.
China ranks 10th overall but fifth in innovation outputs, outperforming several major advanced economies.
The world’s innovation leaders remain remarkably consistent, with high-income economies dominating the rankings. Still, emerging innovation hubs are making gains, and the UAE has reached the top 25.
This visualization maps the world’s most innovative economies using the WIPO Global Innovation Index 2026, which ranks 139 economies across 79 indicators.
Which Countries Lead Global Innovation?
The table below shows the top economies in WIPO’s Global Innovation Index, alongside their income classifications.
RankEconomyScoreIncome Group
1 Switzerland66.7High-income
2 Sweden63.2High-income
3 United States62.3High-income
4 South Korea61.4High-income
5 Singapore61.0High-income
6 United Kingdom59.6High-income
7 Netherlands58.4High-income
8 Finland57.9High-income
9 Denmark57.7High-income
10 China57.0Upper middle-income
11 Germany56.8High-income
12 Japan54.1High-income
13 France54.0High-income
14 Hong Kong, China53.2High-income
15 Israel52.2High-income
16 Canada51.1High-income
17 Estonia50.4High-income
18 Austria50.2High-income
19 Ireland50.1High-income
20 Australia49.6High-income
21 Norway48.5High-income
22 Belgium48.5High-income
23 Luxembourg46.6High-income
24 New Zealand46.4High-income
25 United Arab Emirates46.4High-income
26 Iceland46.3High-income
27 Italy46.2High-income
28 Spain45.4High-income
29 Cyprus45.3High-income
30 Portugal44.5High-income
31 Malta43.8High-income
32 Lithuania43.2High-income
33 Czech Republic42.8High-income
34 Malaysia41.8Upper middle-income
35 Slovenia41.1High-income
36 Hungary40.7High-income
37 Bulgaria40.3High-income
38 India40.1Lower middle-income
39 Poland39.5High-income
40 Latvia38.3High-income
41 Greece38.2High-income
42 Saudi Arabia37.9High-income
43 Viet Nam37.7Lower middle-income
44 Thailand37.6Upper middle-income
45 Türkiye37.5Upper middle-income
46 Croatia36.9High-income
47 Qatar36.6High-income
48 Slovakia36.5High-income
49 Romania35.3High-income
50 Mauritius34.1Upper middle-income
51 Chile33.8High-income
52 Philippines33.8Lower middle-income
53 Brazil33.5Upper middle-income
54 Morocco32.8Lower middle-income
55 Indonesia32.7Upper middle-income
56 Serbia32.5Upper middle-income
57 Georgia32.2Upper middle-income
58 Russian Federation31.8High-income
59 Armenia31.6Upper middle-income
60 Jordan31.5Lower middle-income
61 North Macedonia31.2Middle-income
62 Kuwait30.9High-income
63 South Africa30.9Middle-income
64 Bahrain30.8High-income
65 Mexico30.6Middle-income
66 Uruguay30.5High-income
67 Ukraine30.4Middle-income
68 Republic of Moldova30.3Middle-income
69 Oman30.0High-income
70 Costa Rica29.8High-income
71 Tunisia29.3Lower middle-income
72 Mongolia29.1Middle-income
73 Kazakhstan29.1Middle-income
74 Bhutan28.9Lower middle-income
75 Argentina28.8Middle-income
76 Montenegro28.8Middle-income
77 Uzbekistan28.7Lower middle-income
78 Colombia28.6Middle-income
79 Albania28.3Middle-income
80 Peru27.9Middle-income
81 Iran (Islamic Republic of)27.6Middle-income
82 Botswana27.1Middle-income
83 Egypt26.1Lower middle-income
84 Bosnia and Herzegovina26.1Middle-income
85 Azerbaijan25.8Middle-income
86 Lebanon25.6Lower middle-income
87 Jamaica24.9Middle-income
88 Belarus24.5Middle-income
89 Panama24.4High-income
90 Senegal24.4Middle-income
91 Barbados24.2High-income
92 Kyrgyzstan24.1Middle-income
93 Cambodia23.8Middle-income
94 Sri Lanka23.7Middle-income
95 Pakistan23.7Middle-income
96 Rwanda23.3Low-income
97 Kenya23.0Middle-income
98 Brunei Darussalam23.0High-income
99 Dominican Republic22.9Middle-income
100 El Salvador22.8Middle-income
101 Ghana22.6Middle-income
102 Namibia22.5Middle-income
103 Cabo Verde22.4Middle-income
104 Nepal22.3Middle-income
105 Bangladesh21.5Middle-income
106 Ecuador21.3Middle-income
107 Trinidad and Tobago21.2High-income
108 Lao People's Democratic Republic21.2Middle-income
109 Paraguay21.1Middle-income
110 Côte d'Ivoire20.8Middle-income
111 Algeria20.5Middle-income
112 Tajikistan20.3Middle-income
113 Madagascar20.2Low-income
114 Bolivia (Plurinational State of)19.7Middle-income
115 Zambia19.5Middle-income
116 Honduras19.2Middle-income
117 Benin19.1Middle-income
118 Nigeria19.1Middle-income
119 United Republic of Tanzania19.0Middle-income
120 Guatemala19.0Middle-income
121 Cameroon18.9Middle-income
122 Togo18.7Low-income
123 Uganda18.4Low-income
124 Nicaragua18.0Middle-income
125 Myanmar17.4Middle-income
126 Malawi17.2Low-income
127 Venezuela (Bolivarian Republic of)16.7Not classified
128 Lesotho16.5Middle-income
129 Mozambique16.1Low-income
130 Burkina Faso16.1Low-income
131 Mauritania16.1Middle-income
132 Zimbabwe16.1Middle-income
133 Ethiopia15.7Not classified
134 Mali15.2Low-income
135 Burundi15.1Low-income
136 Angola13.0Middle-income
137 Democratic Republic of the Congo12.6Low-income
138 Niger12.1Low-income
139 Chad9.5Low-income
Switzerland leads with a score of 66.7, ahead of Sweden (63.2) and the United States (62.3). South Korea and Singapore round out the top five, highlighting the strength of established innovation hubs across Europe, North America, and Asia.
WIPO evaluates five innovation input pillars: institutions, human capital and research, infrastructure, market sophistication, and business sophistication. Two output pillars measure knowledge and technology outputs and creative outputs.
Europe Dominates the Top Tier
Europe claims 14 of the top 25 positions, including six of the top 10. All 14 are high-income economies, reflecting the region’s established research institutions and economic resources.
The European Commission’s 2026 Innovation Scoreboard also finds that EU innovation performance has increased steadily since 2019. However, WIPO identifies a continuing challenge for the region: converting its research and industrial strengths into fast-growing firms, scale-up financing, and productivity growth.
Sustaining this advantage will require Europe to expand its talent base as technologies such as AI become more widely adopted. A potential constraint is the availability of workers with advanced digital capabilities, making the EU’s 2030 goal for digital skills increasingly relevant to its long-term innovation capacity.
Asia’s Innovation Landscape Is More Mixed
Asia’s innovation leaders span different economic models. South Korea ranks fourth and Singapore fifth, while China places 10th with a score of 57.0, ahead of Germany, Japan, and France.
China’s performance is particularly notable when inputs and outputs are measured separately. It ranks 22nd for innovation inputs but fifth for outputs, suggesting that its innovation system generates results well above what its input ranking alone would imply.
Elsewhere, India, Vietnam, the Philippines, and Indonesia are among the middle-income economies that have climbed significantly in the innovation rankings since 2013.
The Gulf Has Inputs, Now Comes Conversion
Several high-income Gulf economies face a different challenge: translating substantial innovation investments into measurable results.
The UAE ranks 25th, while Saudi Arabia, Qatar, and Kuwait also moved higher in 2026. Despite their strong institutions, infrastructure, and investment foundations, WIPO finds that these economies still have room to improve how effectively they convert inputs into knowledge and creative outputs.
AI Investment Is Heavily Concentrated in North America
The United States ranks third and Canada 16th, with both classified as high-income economies. North America also dominates AI investment, capturing 86% of global AI-related venture capital value in the first half of 2026.
The rankings highlight how difficult it remains to break into the world’s innovation elite, even as technological capabilities spread across more economies. Looking ahead, leadership may depend less on spending alone and more on how effectively countries turn research, talent, and investment into tangible results.
Learn More on the Voronoi App
To see how today’s technological shifts fit into a much longer pattern, explore Long Waves: The History of Innovation Cycles on the Voronoi app.
Related articles

A week with Googlebooks: four notes from our testing so far
Google's new operating system is off to a rocky start.

Instinct was the buzziest AI agent around — can it survive Muse?
Before there were cute little guys, there was Instinct. In August, the startup got its AI agent to market with an unusual playbook: invite-only, no marketing, and barely so much as a website.

Japan’s new 3,300-ton submarine enters water with advanced stealth technology
Japan’s latest Taigei-class submarine entered the water in Kobe on October 8, bringing the country’s...
‘World-first’ 1 keV fusion milestone set without lasers or superconducting magnets
Scientists have superheated a trapped plasma to more than 12 million degrees Celsius (21.6 million...
Largest Mireo hydrogen train deployment gets 4.8 MW fuel cell boost
Siemens Mobility’s largest Mireo Plus H hydrogen train deployment has secured its fuel cell supply,...
Last Energy’s 5 MW pilot microreactor secures safety clearance from US
Last Energy, a commercial developer of the micromodular nuclear reactors in the US has secured...