
Ranked: The World’s Most and Least Taxed Countries
Some countries collect over 40% of GDP in taxes. Others collect less than 2%. See how countries around the world compare.
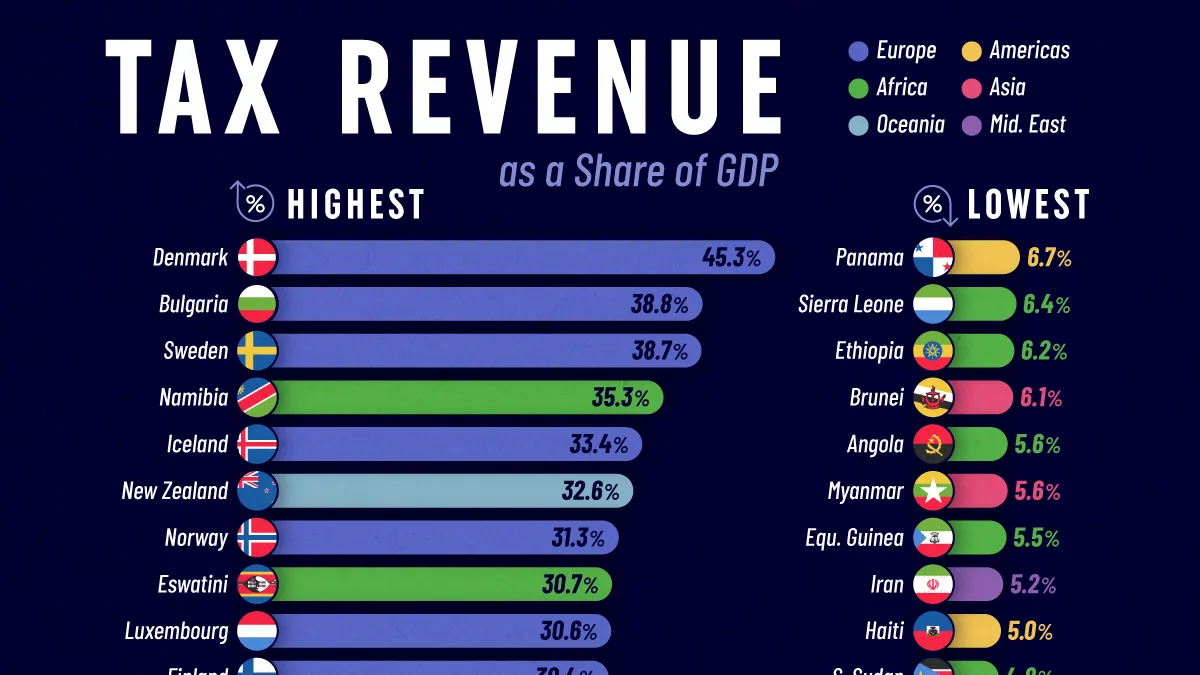
How Countries Compare on Tax Revenue
Key Takeaways
Denmark collects tax revenue equal to 45.3% of GDP, the highest globally, and more than twice the 19.5% collected in the U.S.
Seven of the 10 countries with the highest tax-revenue shares are in Europe.
Several oil-rich economies rank near the bottom, where resource revenues can reduce reliance on conventional taxes.
Tax revenue varies dramatically around the world, reflecting differences in tax systems, economic development, and other sources of government income.
Using the latest data from the International Monetary Fund (IMF), this graphic compares tax revenue as a share of GDP across countries in 2024.
Compare your country with its peers in the final table on this page.
Where Governments Rely Most on Taxes
Among wealthy economies, the differences are substantial. Denmark collects tax revenue equal to 45.3% of GDP, versus roughly 29% in Canada and Australia and just 19.5% in the United States.
RankCountryTax Revenue as % of GDP (2024)
1 Denmark45.3%
2 Bulgaria38.8%
3 Sweden38.7%
4 Namibia35.3%
5 Iceland33.4%
6 New Zealand32.6%
7 Norway31.3%
8 Eswatini30.7%
9 Luxembourg30.7%
10 Finland30.4%
11 Italy29.6%
12 Belgium29.6%
13 Canada29.5%
14 Australia29.4%
15 Montenegro29.0%
16 France28.7%
17 UK28.5%
18 Austria28.3%
19 Greece27.8%
20 Barbados27.8%
These differences partly reflect how countries structure their tax systems and fund public services.
Nordic countries generally have broad tax bases that help finance extensive public programs, while the U.S. relies more heavily on private spending in areas such as healthcare and retirement.
The World’s Least Taxed Countries
At the other end of the ranking, oil-rich economies sit alongside some of the world’s poorest countries. Both collect relatively little in taxes, but for very different reasons.
RankCountryTax Revenue as a % of GDP (2024)
1 Libya1.2%
2 Kuwait1.4%
3 Iraq1.7%
4 Yemen2.0%
5 Sudan2.0%
6 Somalia2.2%
7 Nigeria3.4%
8 Qatar3.8%
9 Bahrain4.4%
10 Oman4.5%
11 South Sudan4.8%
12 Haiti5.0%
13 Iran5.2%
14 Equatorial Guinea5.5%
15 Angola5.6%
16 Myanmar5.6%
17 Brunei6.1%
18 Ethiopia6.2%
19 Sierra Leone6.4%
20 Panama6.7%
For major oil producers, natural resources provide an alternative source of government revenue. Kuwait collects just 1.4% of GDP in taxes, while Qatar, Bahrain, and Oman are all below 5%.
In lower-income countries, low tax collections can instead reflect large informal economies and limited tax-collection capacity. Similar tax levels can therefore result from resource wealth in one country and difficulty raising revenue in another.
America’s Growing Tax and Spending Gap
The U.S. occupies an interesting position in the global comparison. Its tax take is lower than that of many other advanced economies, while federal spending is projected to remain substantially higher than federal revenues.
In 2026, federal spending is projected at 23.3% of GDP, versus revenues of 17.5%. By 2036, those figures are projected to reach 24.4% and 17.8%, respectively. Meanwhile, net interest is projected to more than double to $2.1 trillion, nearly matching all federal discretionary spending.
This leaves a persistent gap between what the federal government collects and what it spends, while a growing share of the budget goes toward servicing past borrowing.
Tax Revenue Around the World
Countries’ tax revenues vary based on development levels, institutional capacity, tax systems, and resource wealth. The table below lists countries worldwide by tax revenue as a percentage of GDP in 2024.
CountryTax Revenue as % of GDP (2024)
Afghanistan10.9%
Albania19.8%
Algeria9.4%
Andorra15.8%
Angola5.6%
Antigua and Barbuda15.6%
Argentina22.8%
Armenia22.4%
Aruba21.0%
Australia29.4%
Austria28.3%
Azerbaijan17.8%
Bahrain4.4%
Bangladesh7.4%
Barbados27.8%
Belarus27.2%
Belgium29.6%
Belize23.2%
Benin13.2%
Bhutan10.8%
Bolivia17.8%
Bosnia and Herzegovina22.6%
Botswana22.4%
Brazil25.6%
Brunei Darussalam6.1%
Bulgaria38.8%
Burkina Faso18.8%
Burundi12.1%
Cabo Verde19.4%
Cambodia12.5%
Cameroon12.7%
Canada29.5%
Central African Republic7.8%
Chad7.4%
Chile19.6%
China13.0%
Colombia23.0%
Comoros8.9%
Costa Rica13.2%
Cote d'Ivoire13.6%
Croatia27.2%
Cyprus25.3%
Czech Republic18.9%
DR Congo9.8%
Denmark45.3%
Djibouti11.0%
Dominica22.3%
Dominican Republic14.5%
Ecuador13.6%
Egypt11.7%
El Salvador21.6%
Equatorial Guinea5.5%
Estonia22.9%
Eswatini30.7%
Ethiopia6.2%
Fiji22.3%
Finland30.4%
France28.7%
Gabon13.3%
Georgia24.9%
Germany23.0%
Ghana13.3%
Greece27.8%
Grenada23.6%
Guatemala11.8%
Guinea12.3%
Guinea-Bissau8.8%
Guyana8.2%
Haiti5.0%
Honduras17.5%
Hong Kong SAR14.2%
Hungary24.7%
Iceland33.4%
India18.1%
Indonesia10.1%
Iran5.2%
Iraq1.7%
Ireland20.5%
Israel24.9%
Italy29.6%
Jamaica25.6%
Japan20.2%
Jordan15.4%
Kazakhstan16.0%
Kenya12.9%
Kiribati17.5%
Korea13.2%
Kosovo27.1%
Kuwait1.4%
Kyrgyz Republic21.8%
Lao P.D.R12.4%
Latvia22.8%
Lebanon10.3%
Lesotho23.5%
Liberia11.6%
Libya1.2%
Liechenstein14.5%
Lithuania22.3%
Luxembourg30.7%
Macao SAR25.9%
Madagascar11.4%
Malawi14.1%
Malaysia12.5%
Maldives24.3%
Mali15.8%
Malta23.1%
Marshall Islands13.9%
Mauritania15.3%
Mauritius23.1%
Mexico15.7%
Micronesia16.5%
Moldova21.2%
Mongolia23.9%
Montenegro29.0%
Morocco20.8%
Mozambique20.3%
Myanmar5.6%
Namibia35.3%
Nauru19.4%
Nepal16.4%
Netherlands26.5%
New Zealand32.6%
Nicaragua20.9%
Niger6.9%
Nigeria3.4%
North Macedonia18.9%
Norway31.3%
Oman4.5%
Pakistan9.9%
Palau21.7%
Panama6.7%
Papua New Guinea12.1%
Paraguay11.4%
Peru14.3%
Philippines15.4%
Poland22.2%
Portugal24.9%
Qatar3.8%
Republic of Congo10.6%
Romania16.4%
Russia19.2%
Rwanda13.8%
Samoa24.1%
San Marino17.6%
Sao Tome and Principe10.8%
Saudi Arabia7.2%
Senegal18.2%
Serbia23.5%
Seychelles27.4%
Sierra Leone6.4%
Singapore14.3%
Slovak Republic19.6%
Slovenia21.5%
Solomon Islands21.4%
Somalia2.2%
South Africa25.2%
South Sudan4.8%
Spain23.9%
Sri Lanka12.4%
St. Kitts and Nevis15.2%
St. Lucia19.7%
St. Vincent and the Grenadines23.6%
Sudan2.0%
Suriname18.9%
Sweden38.7%
Switzerland20.0%
Tajikistan17.1%
Tanzania11.9%
Thailand16.0%
The Bahamas17.3%
The Gambia11.1%
Timor-Leste9.1%
Togo14.9%
Tonga22.0%
Trinidad and Tobago21.9%
Tunisia25.3%
Turkmenistan11.9%
Tuvalu17.0%
Türkiye16.6%
UAE18.2%
Uganda12.9%
Ukraine27.4%
United Kingdom28.5%
United States19.5%
Uruguay18.2%
Uzbekistan13.6%
Vanuatu13.9%
Vietnam13.0%
West Bank and Gaza25.6%
Yemen2.0%
Zambia17.3%
Zimbabwe11.6%
Learn More on the Voronoi App
To learn more about this topic, check out this graphic breaking down income tax revenue by wealth bracket in America.
Related articles
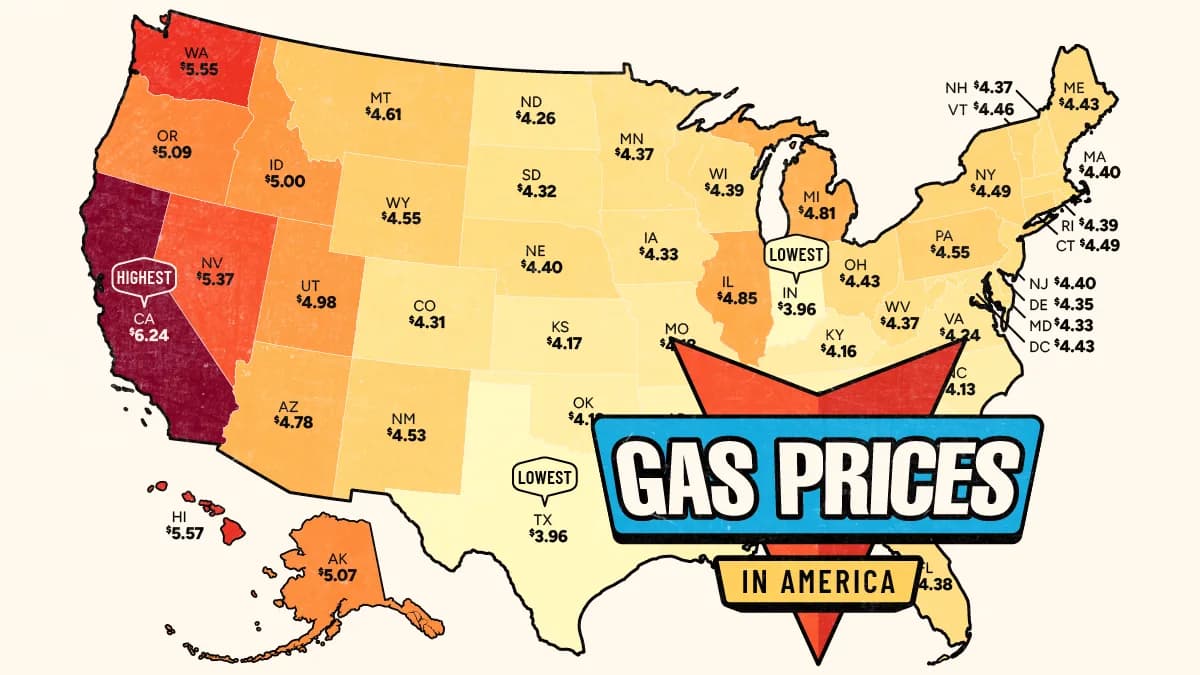
Mapped: Gas Prices by U.S. State in 2026
Gas prices may be high nationwide, but living in one state or another can amount to over $30 difference at the pump.
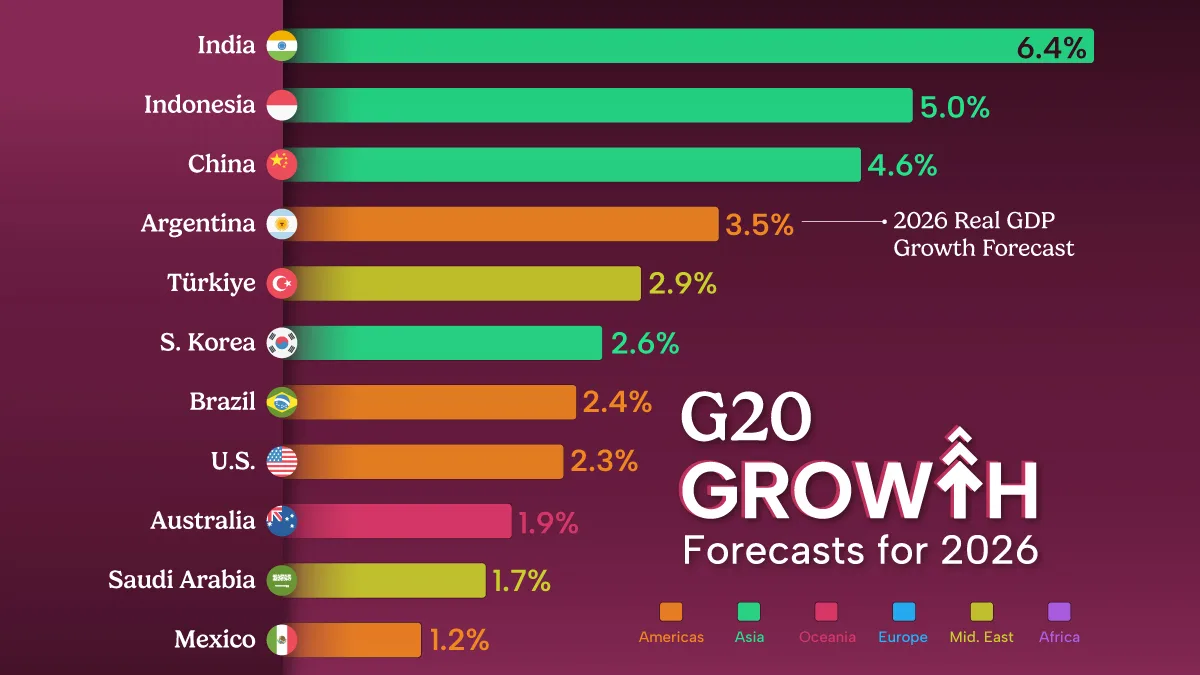
Ranked: The Fastest-Growing Major Economies in 2026
While Europe's major economies struggle with stagnation, Asian emerging markets are forecasted to see 5% growth in 2026.
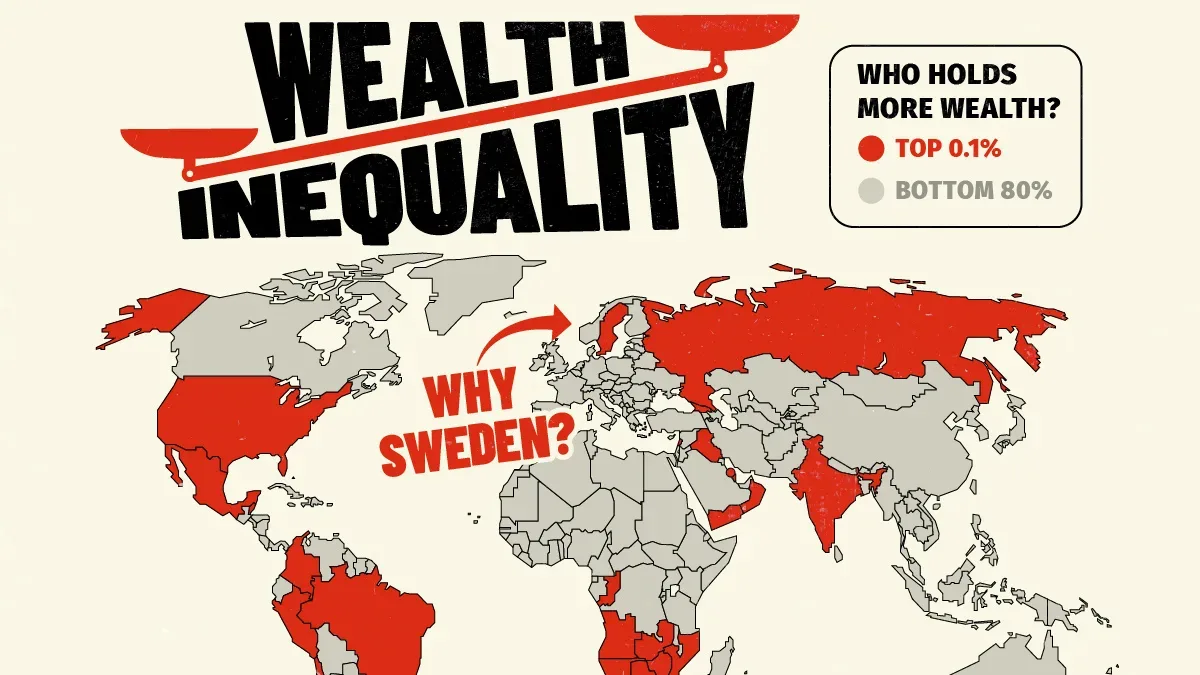
Where the Richest 0.1% Hold More Wealth Than the Bottom 80%
In just 27 countries around the world, the richest of the rich own more wealth than the bottom 80% of the population combined.
Ranked: U.S. Jobs Adding the Most Workers by 2035
Explore the jobs in the U.S. projected to add the most workers by 2035, led by home care, healthcare, and technology roles.
Ranked: U.S. Wealth by Generation in 2026
Baby Boomers make up 30% of U.S. households but hold 52% of America's $185.7 trillion in household net worth.
Which Countries Give New Parents the Most Paid Leave?
Paid time for new parents ranges from nearly four years to zero across the OECD. See which countries offer the most.