
Mapped: Lifetime Property Taxes in Every U.S. State
Property taxes can vary nearly 15-fold across states. See where homeowners face the biggest lifetime bills and what drives the differences.
This story was prepared automatically by software.
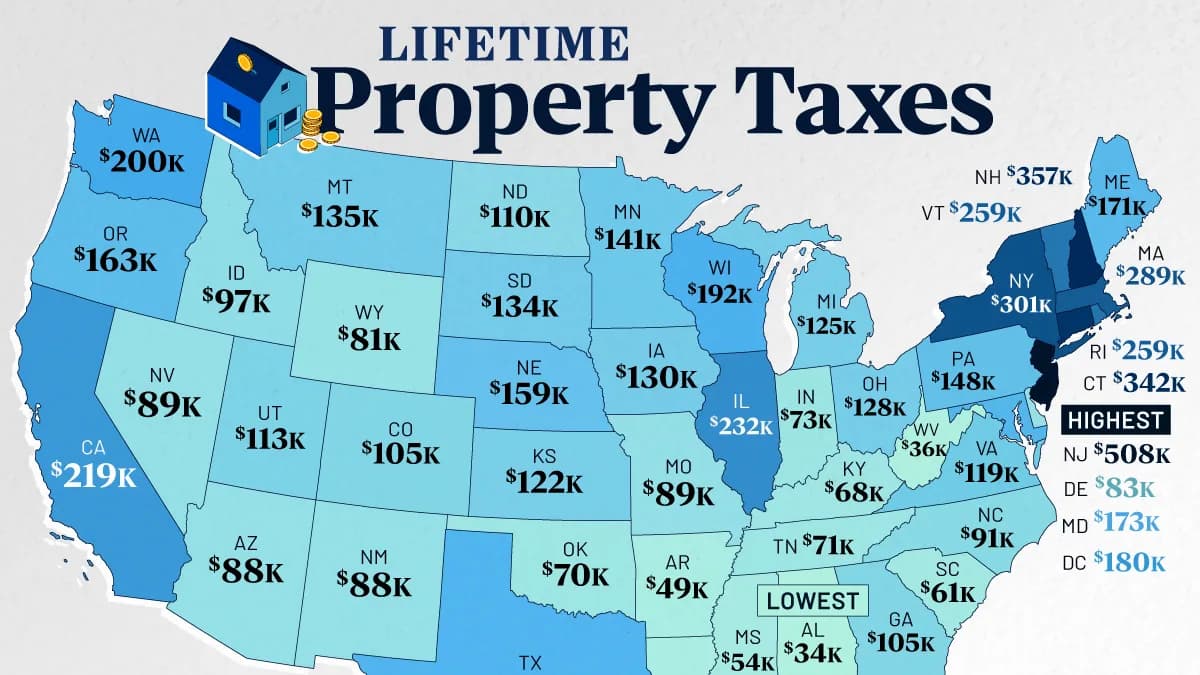
How Much Do Americans Pay in Lifetime Property Taxes?
Key Takeaways
New Jersey homeowners face an estimated $508,000 in lifetime property taxes, nearly 15 times Alabama’s $34,000.
Seven of the eight states with the highest estimated lifetime property taxes are in the Northeast.
California’s expensive housing market pushes lifetime property taxes to $219,000, despite its relatively low tax rate.
Buying a home is only the beginning of what you’ll pay for it. Over decades of ownership, property taxes can add hundreds of thousands of dollars to the cost of a home, depending on where you live.
This map shows estimated lifetime property taxes across the U.S., based on research from Self Financial using Zillow home values and approximately 40 years of homeownership.
Where Property Taxes Cost Homeowners the Most
The following table ranks states by estimated lifetime property taxes, based on home values at the end of 2025.
RankStateLifetime Property Tax
1New Jersey$508,156
2New Hampshire$357,365
3Connecticut$341,545
4New York$301,043
5Massachusetts$289,352
6Rhode Island$259,440
7Vermont$258,561
8Illinois$231,661
9California$219,043
10Washington$199,665
11Wisconsin$191,551
12Texas$185,246
13Washington D.C.$180,329
14Alaska$177,738
15Maryland$172,746
16Maine$170,685
17Oregon$162,920
18Nebraska$159,194
19Pennsylvania$147,688
20Minnesota$141,222
21Montana$134,728
22South Dakota$133,509
23Iowa$129,796
24Ohio$127,960
25Michigan$125,226
26Florida$122,370
27Kansas$122,137
28Virginia$119,300
29Utah$112,944
30North Dakota$110,387
31Georgia$105,398
32Colorado$105,393
33Hawaii$101,856
34Idaho$97,173
35North Carolina$91,351
36Missouri$89,363
37Nevada$88,825
38Arizona$87,859
39New Mexico$87,838
40Delaware$82,667
41Wyoming$81,033
42Indiana$72,547
43Tennessee$70,644
44Oklahoma$70,084
45Kentucky$68,421
46South Carolina$60,509
47Mississippi$54,337
48Arkansas$48,821
49Louisiana$45,149
50West Virginia$36,037
51Alabama$34,190
New Jersey, New Hampshire, and Connecticut occupy the top three spots, with estimated lifetime property tax bills exceeding $340,000 in each state. New York and Massachusetts round out the top five.
The contrast is especially sharp across state lines. Illinois homeowners could pay more than triple neighboring Indiana’s $72,547, a difference of roughly $159,000.
At the other end of the ranking, Alabama’s estimated lifetime bill is just $34,190. Compared with New Jersey, that’s nearly half a million dollars less in property taxes over 40 years.
Why Property Taxes Vary So Much by State
Property tax bills depend on home values and tax rates, sometimes producing surprising results.
California’s effective property tax rate was 0.70% in 2024, compared with 1.88% in Illinois. Yet California’s higher home values bring its estimated lifetime bill to $219,043, just $12,618 below Illinois’ $231,661.
How states collect taxes also matters. New Jersey’s average annual residential property tax bill reached a record $10,570 in 2025, an increase of more than 25% over the past decade.
Alabama’s constitutional limits keep property taxes low, shifting more local funding toward sales taxes. These account for roughly half of local tax revenue in Alabama, compared with 19% nationally. Homeowners save on property taxes but face higher taxes on everyday purchases.
How Property Taxes Change the Cost of Owning a Home
Property taxes can reshape the true cost of homeownership. Nationwide, the estimated lifetime bill averages $145,853, or roughly $3,646 annually over 40 years.
Actual payments will vary with changes in home values, local tax policies, and exemptions. For homebuyers, this makes property taxes an important part of comparing housing costs across states. A cheaper home doesn’t always mean lower annual expenses.
Learn More on the Voronoi App
To learn more about housing trends, explore this graphic showing where young adults are most likely to live with their parents.