
Mapped: Where Millennials Own vs. Rent in America
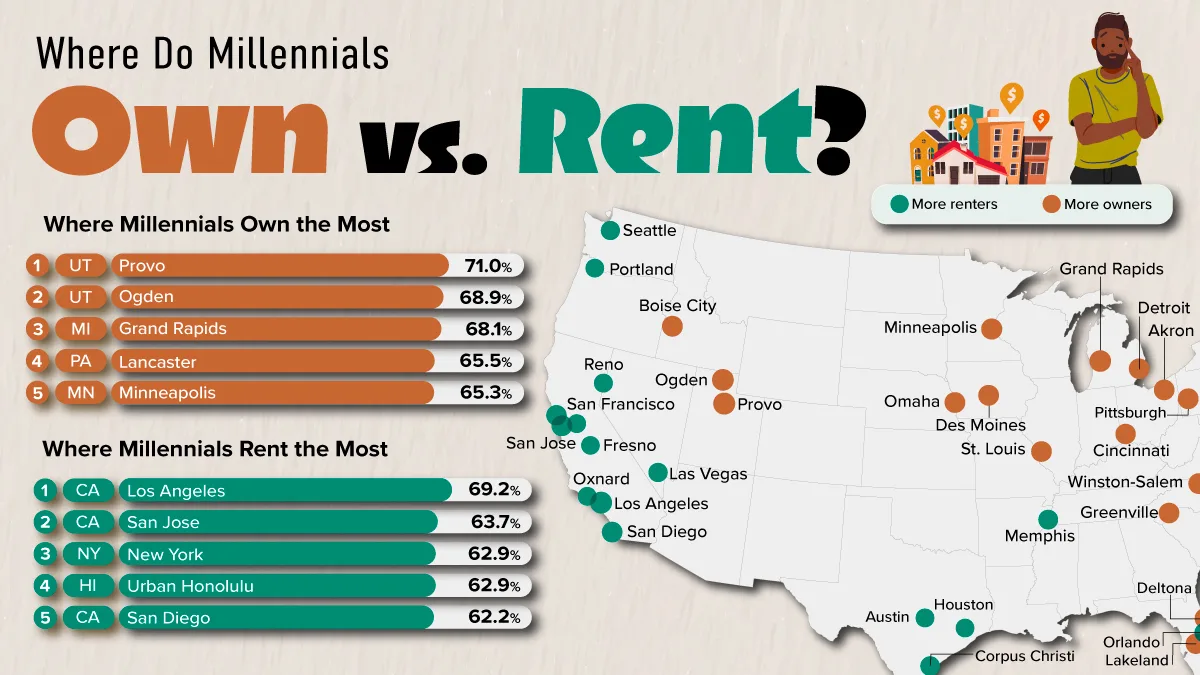
Explore millennial homeownership rates across U.S. cities, from Provo's 71% ownership rate to Los Angeles' 69% rental rate.
Where Are Millennials Buying Homes or Renting?
Key Takeaways
A majority of millennial households nationwide (54%) owned their homes in 2024, while 46% rented.
Provo, Utah, had the highest millennial homeownership rate among the metros analyzed (71.0%), while Los Angeles, California, had the highest rental rate (69.2%).
For millennials, the likelihood of owning a home varies dramatically depending on where they live. In some U.S. metro areas, roughly seven in 10 millennial households own their homes. In others, nearly seven in 10 rent.
This visualization maps the U.S. metro areas where millennials are most likely to own or rent, using data from IPUMS USA and the University of Minnesota’s harmonized 2024 American Community Survey (ACS) 1-Year microdata.
The analysis covers 108 U.S. metro areas with at least 50,000 millennial households, comparing ownership and rental rates rather than the total number of homeowners or renters.
Utah and the Midwest Lead in Millennial Homeownership
Utah claims the top two spots for millennial homeownership. In Provo, 71.0% of millennial households own their homes, followed by nearby Ogden at 68.9%. Grand Rapids, Michigan, ranks third at 68.1%.
RankMetro areaStateMillennial households that own (2024)
1ProvoUT71.0%
2OgdenUT68.9%
3Grand RapidsMI68.1%
4LancasterPA65.5%
5MinneapolisMN65.3%
6Boise CityID63.8%
7Palm BayFL63.8%
8Des MoinesIA63.5%
9PittsburghPA63.4%
10OmahaNE63.1%
11Winston-SalemNC63.1%
12St. LouisMO62.9%
13AkronOH62.6%
14DeltonaFL62.3%
15GreenvilleSC62.2%
16CharlestonSC62.0%
17DetroitMI61.7%
18LakelandFL61.3%
19CincinnatiOH61.2%
20AnchorageAK61.2%
Utah’s high millennial homeownership rates may partly reflect the state’s tendency toward earlier marriage and family formation, alongside strong employment growth.
Historically more attainable housing prices in places like Ogden may also have helped younger households enter the market. However, rising home prices and elevated mortgage rates have made buying increasingly difficult for prospective homeowners.
Other high-ranking metros include Lancaster, Pennsylvania (65.5%), Minneapolis, Minnesota (65.3%), and Des Moines, Iowa (63.5%), highlighting a strong showing across parts of the Midwest.
These markets contrast sharply with rental-heavy coastal metros, although local incomes, household composition, and the timing of home purchases can also shape homeownership rates.
Millennials Are More Likely to Rent in Coastal Cities
Los Angeles is nearly the mirror image of Provo. While roughly seven in 10 millennial households own their homes in Provo, nearly seven in 10 rent in Los Angeles (69.2%).
San Jose follows with a 63.7% rental rate, while New York and Urban Honolulu are tied at 62.9%.
RankMetro areaStateMillennial households that rent (2024)
1Los AngelesCA69.2%
2San JoseCA63.7%
3New YorkNY62.9%
4Urban HonoluluHI62.9%
5San DiegoCA62.2%
6San FranciscoCA60.9%
7MemphisTN56.9%
8MiamiFL56.6%
9Corpus ChristiTX56.0%
10OrlandoFL54.5%
11Las VegasNV54.1%
12SeattleWA53.3%
13RenoNV52.1%
14AustinTX51.6%
15ModestoCA51.2%
16OxnardCA51.1%
17HoustonTX51.0%
18BostonMA50.8%
19PortlandOR50.7%
20FresnoCA50.3%
San Diego (62.2%) and San Francisco (60.9%) also rank near the top, making high-cost coastal markets especially prominent among the most rental-heavy metros.
Expensive housing and the challenge of saving for a down payment may help explain this pattern. However, these figures measure whether households own or rent, not the reasons behind their housing decisions.
In Los Angeles, for example, a typical home costs around $860,000, putting homeownership out of reach for many households without substantial savings or high incomes.
The South Shows a More Mixed Picture
Unlike the more pronounced patterns in Utah and coastal California, the South has metros near the top of both rankings.
Palm Bay, Florida, has a 63.8% millennial homeownership rate, while Winston-Salem, North Carolina (63.1%), and Greenville, South Carolina (62.2%), also rank among the leading ownership markets.
Meanwhile, renting is more common in Memphis, Tennessee (56.9%), Miami, Florida (56.6%), and Orlando, Florida (54.5%).
While wages tend to be lower across much of the South, relatively affordable housing has historically made homeownership more accessible in many markets.
However, population growth in states like Florida has increased housing demand, contributing to rising prices and making homeownership less attainable for some younger households.
Learn More on the Voronoi App
If you enjoyed today’s post, check out Ranked: U.S. Wealth by Generation in 2026 on Voronoi.
Source: https://www.visualcapitalist.com/mapped-where-millennials-own-vs-rent-in-america/
Related articles
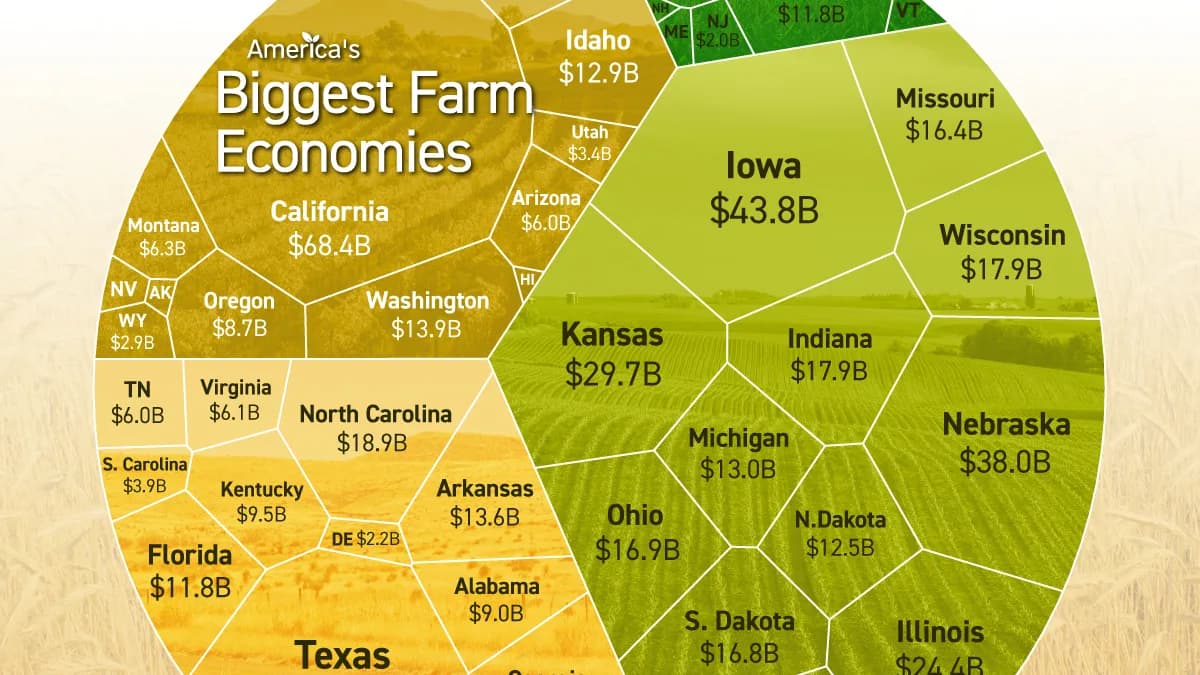
Ranked: America’s Biggest Farm Economies in 2025
California is America's largest agricultural economy, but the Midwest as a region produces nearly half of U.S. agricultural production value.
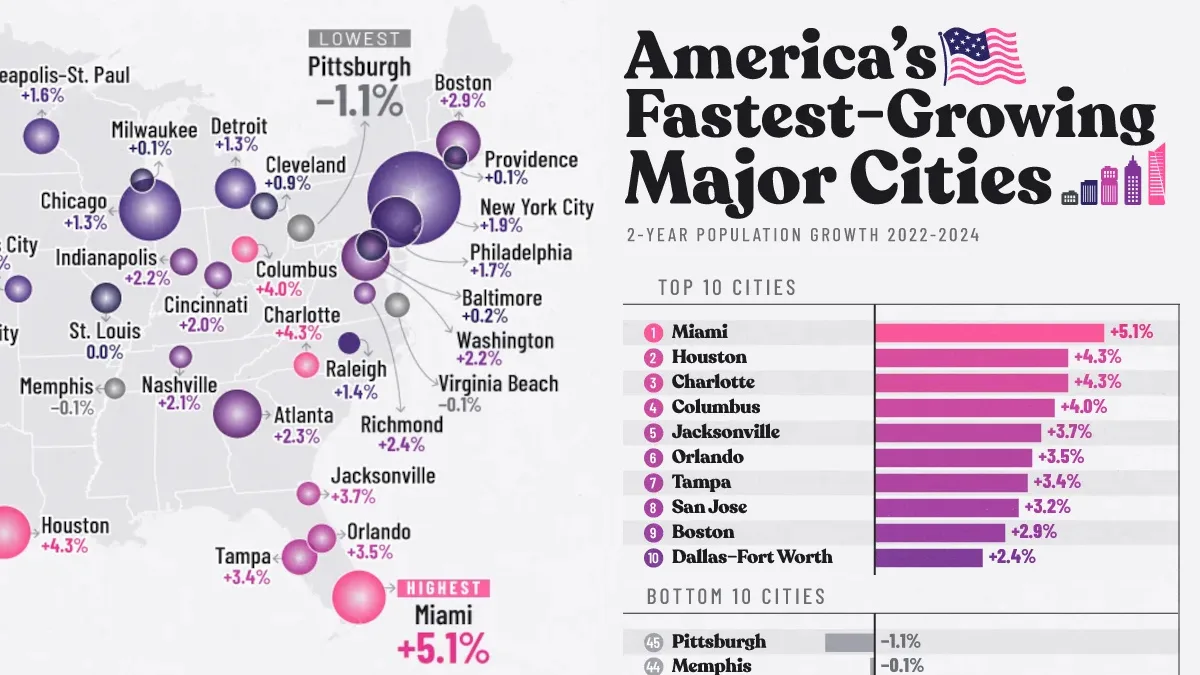
Mapped: America’s Fastest-Growing Major Cities
Explore the fastest-growing cities in America. Miami leads 45 major urban areas in population growth from 2022 to 2024.
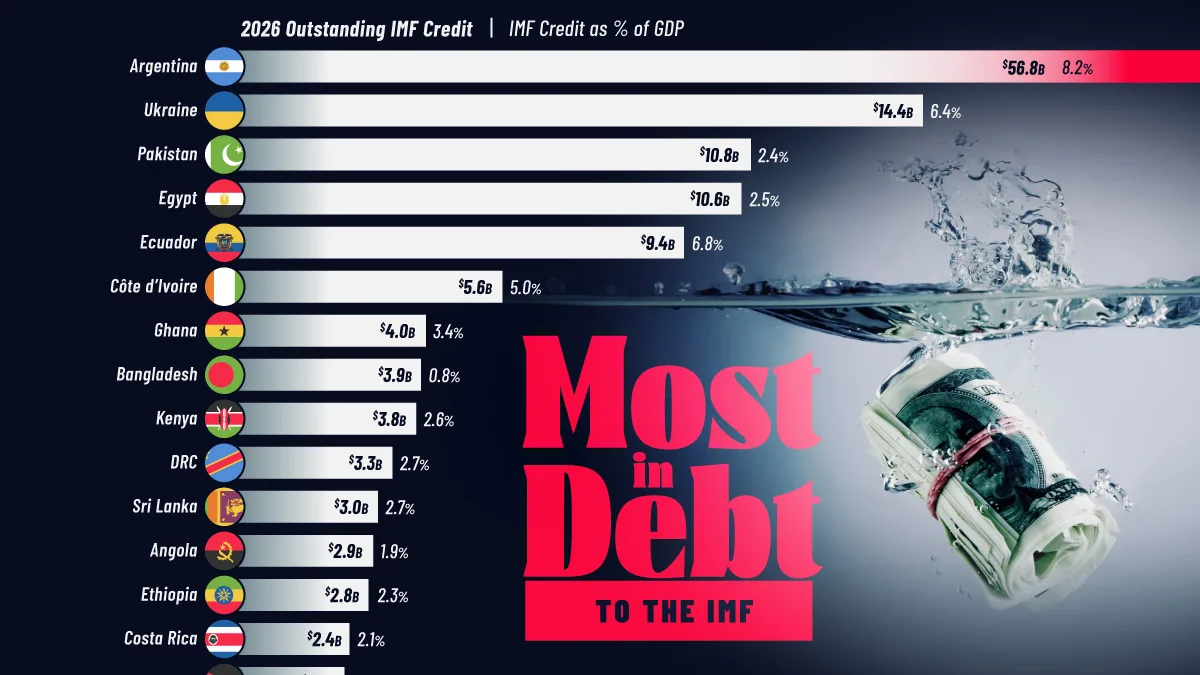
Ranked: Countries That Owe the Most Money to the IMF
Argentina used to be richer than Europe and has not faced war in decades. Today it owes more to the IMF than any other country.
Charted: The Three Waves of the U.S. Trade Deficit (1990–2026)
The U.S. trade deficit in semiconductors and AI hardware hit an annualized $546 billion in Q2 2026, overtaking machinery and oil's 2008 peak.
Mapped: Unemployment Rates in Every U.S. State in 2026
The U.S. has nearly four percent unemployment in 2026. West Coast states like California drive up the national average.
Ranked: 125 European Cities by Quality of Life and Cost
Which European cities offer the best quality of life for the lowest cost? Explore 125 cities ranked by affordability and livability.