
Ranked: America’s Biggest Farm Economies in 2025
California is America's largest agricultural economy, but the Midwest as a region produces nearly half of U.S. agricultural production value.
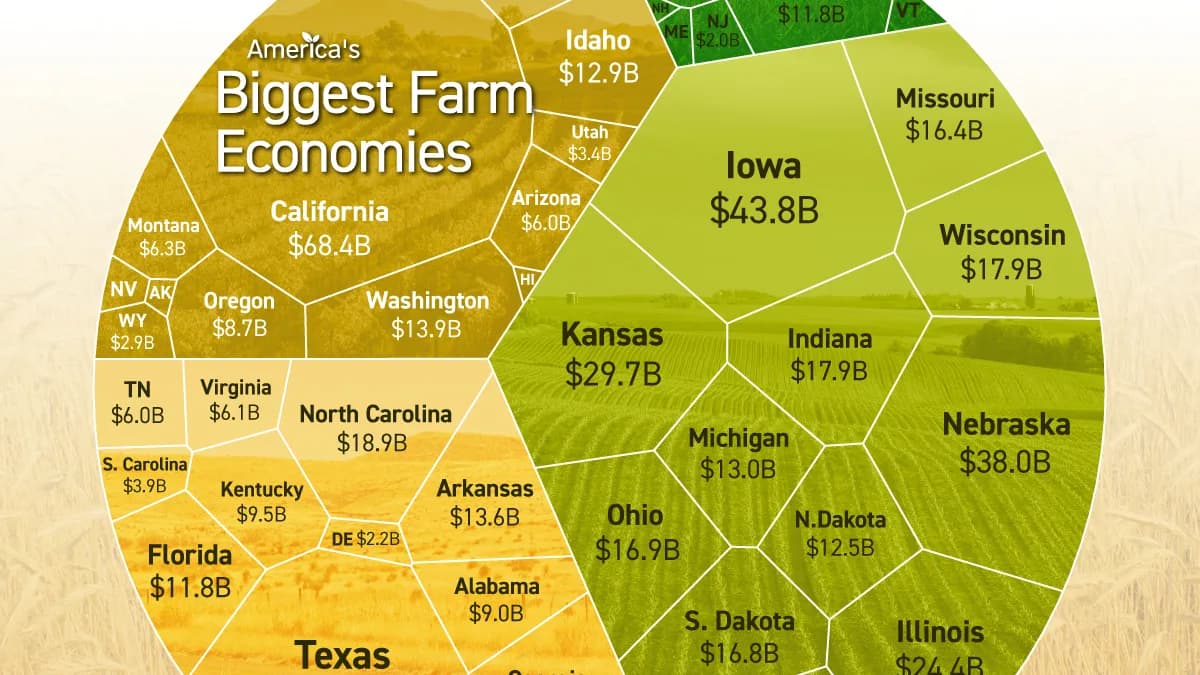
Which States Have America’s Biggest Farm Economies?
Key Takeaways
California’s farms produced $68.4 billion in agricultural value in 2025, accounting for 11.3% of the U.S. total and 56% more than second-place Iowa ($43.8 billion).
The Midwest accounted for 45.1% of America’s agricultural production value, making it the country’s largest agricultural region.
California may be better known for Silicon Valley and Hollywood, but it’s also America’s largest agricultural producer, ahead of traditional farming powerhouses like Iowa, Texas, and Nebraska.
This graphic ranks all 50 states by the value of their agricultural production in 2025, using data from the U.S. Department of Agriculture. The measure includes crops, livestock, farm services, and forestry in current dollars, before costs, reflecting the scale of agricultural output rather than farm profits.
California Is America’s Biggest Farm Economy
California’s agricultural production was worth more than the combined output of Iowa and Wisconsin in 2025. The state also generated nearly half (48%) of all agricultural production value in the Western U.S.
California’s lead rests on crops. Its crop production alone was worth $46.8 billion, accounting for 68% of its total and 2.7 times the next-highest state crop total (Illinois, $17.3 billion). California produces more than 400 commodities and grows nearly half of the country’s vegetables and over three-quarters of its fruits and nuts.
The table below ranks all 50 states by agricultural production value in 2025, along with each state’s share of the U.S. total:
RankStateAgricultural Production Value in 2025
Value (USD, Billions)Share of U.S. Total (%)
1California68.411.3
2Iowa43.87.2
3Texas39.96.6
4Nebraska38.06.3
5Kansas29.74.9
6Minnesota26.24.3
7Illinois24.44.0
8North Carolina18.93.1
9Wisconsin17.93.0
10Indiana17.93.0
11Ohio16.92.8
12South Dakota16.82.8
13Missouri16.42.7
14Georgia14.62.4
15Washington13.92.3
16Arkansas13.62.2
17Michigan13.02.2
18Idaho12.92.1
19North Dakota12.52.1
20Oklahoma11.92.0
21Pennsylvania11.82.0
22Colorado11.81.9
23Florida11.81.9
24Kentucky9.51.6
25Alabama9.01.5
26Oregon8.71.4
27New York7.91.3
28Mississippi7.91.3
29Montana6.31.0
30Virginia6.11.0
31Arizona6.01.0
32Tennessee6.01.0
33New Mexico4.90.8
34Louisiana4.70.8
35South Carolina3.90.6
36Maryland3.80.6
37Utah3.40.6
38Wyoming2.90.5
39Delaware2.20.4
40New Jersey2.00.3
41West Virginia1.40.2
42Nevada1.40.2
43Vermont1.10.2
44Maine1.10.2
45Hawaii0.90.2
46Connecticut0.90.1
47Massachusetts0.70.1
48New Hampshire0.40.1
49Rhode Island0.10.0
50Alaska0.10.0
-- U.S. Total606.3100.0
The Midwest led all regions with $273.6 billion in agricultural production value across 12 states, ahead of the South (27.2% of the U.S. total), the West (23.4%), and the Northeast (4.3%).
The Midwest’s dominance reflects both its fertile prairie soils and its massive livestock industry. The region’s dark prairie soils are among the most productive agricultural soils in the world, supporting the corn and soybean production that helps feed its livestock. Iowa alone had 25.3 million hogs at the end of 2025, roughly one-third of the U.S. total.
Livestock, Not Just Crops, Drives Much of the Midwest’s Output
America’s agricultural economy generates more production value from livestock than crops. In 2025, livestock and livestock products generated $303.6 billion nationwide, or 50.1% of the total, compared with $238.2 billion (39.3%) from crops. Farm services and forestry accounted for the remaining 10.6%.
While corn was the top commodity by production value in just four states in 2024, cattle held the top spot in 18 states.
The table below breaks down agricultural production value across the 10 largest state farm economies by crops, livestock, and services and forestry in 2025:
StateShare of Agricultural Production Value by Type in 2025 (%)Total Value, 2025
(USD, Billions)
CropsLivestockServices & Forestry
California68.425.66.068.4
Iowa38.354.17.643.8
Texas17.565.517.039.9
Nebraska31.861.07.238.0
Kansas29.463.96.829.7
Minnesota45.943.011.126.2
Illinois71.019.89.224.4
North Carolina22.163.314.618.9
Wisconsin25.365.39.417.9
Indiana46.344.29.417.9
U.S. Total39.350.110.6606.3
Livestock generated more value than crops in several leading agricultural states, including Iowa ($23.7 billion vs. $16.8 billion), Nebraska ($23.2 billion vs. $12.1 billion), and Kansas ($19.0 billion vs. $8.7 billion). In Texas, livestock accounted for 65% of total agricultural production value.
Illinois stands out as a crop-heavy exception, with crops generating $17.3 billion, or 71% of its agricultural production value. Across the Midwest as a whole, livestock accounted for 49% of production value, compared with 42% for crops.
Learn More on the Voronoi App
If you enjoyed today’s post, check out The States with the Most Farmland on Voronoi.
Related articles
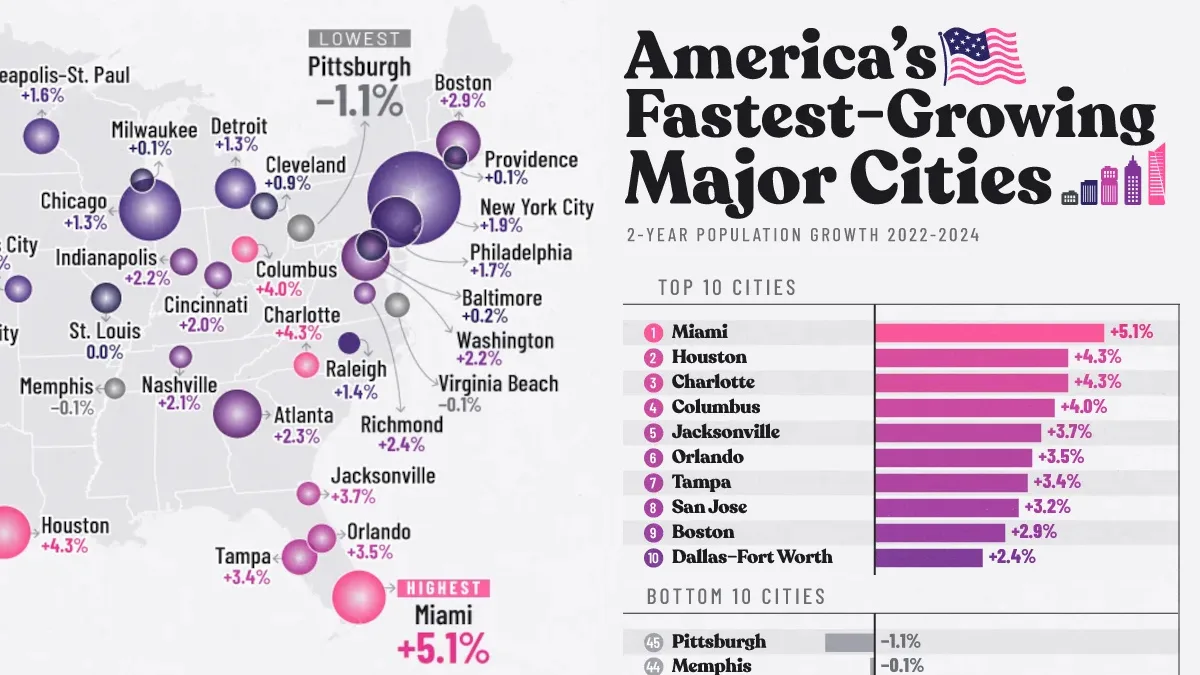
Mapped: America’s Fastest-Growing Major Cities
Explore the fastest-growing cities in America. Miami leads 45 major urban areas in population growth from 2022 to 2024.
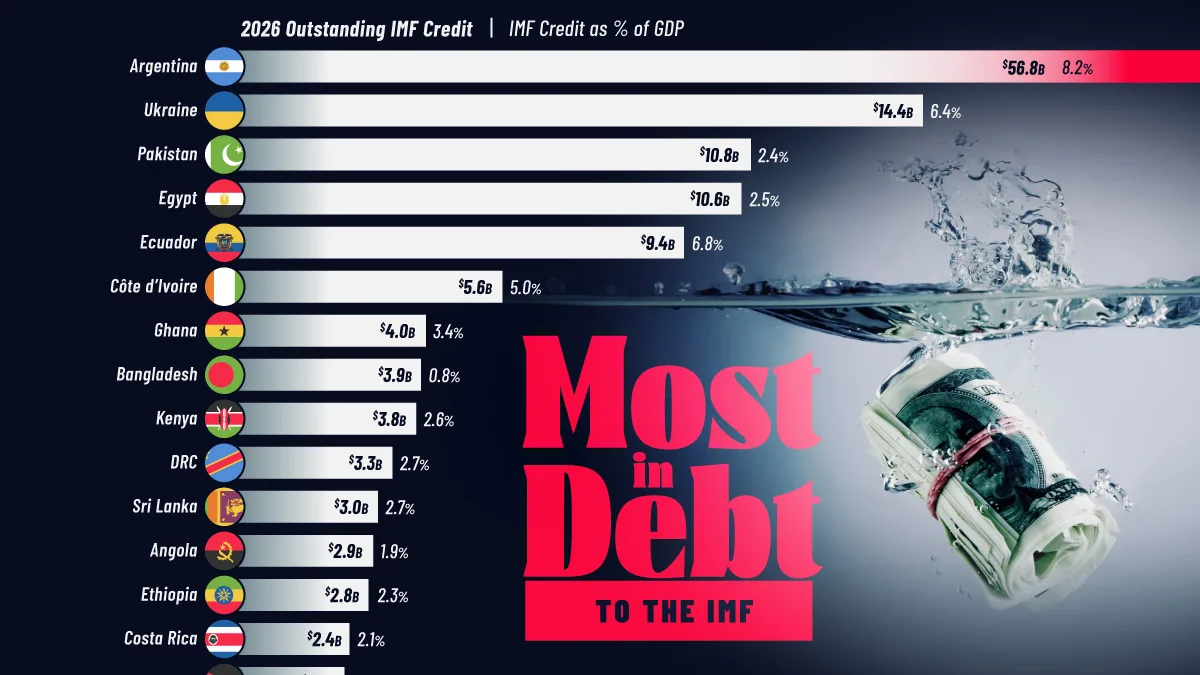
Ranked: Countries That Owe the Most Money to the IMF
Argentina used to be richer than Europe and has not faced war in decades. Today it owes more to the IMF than any other country.
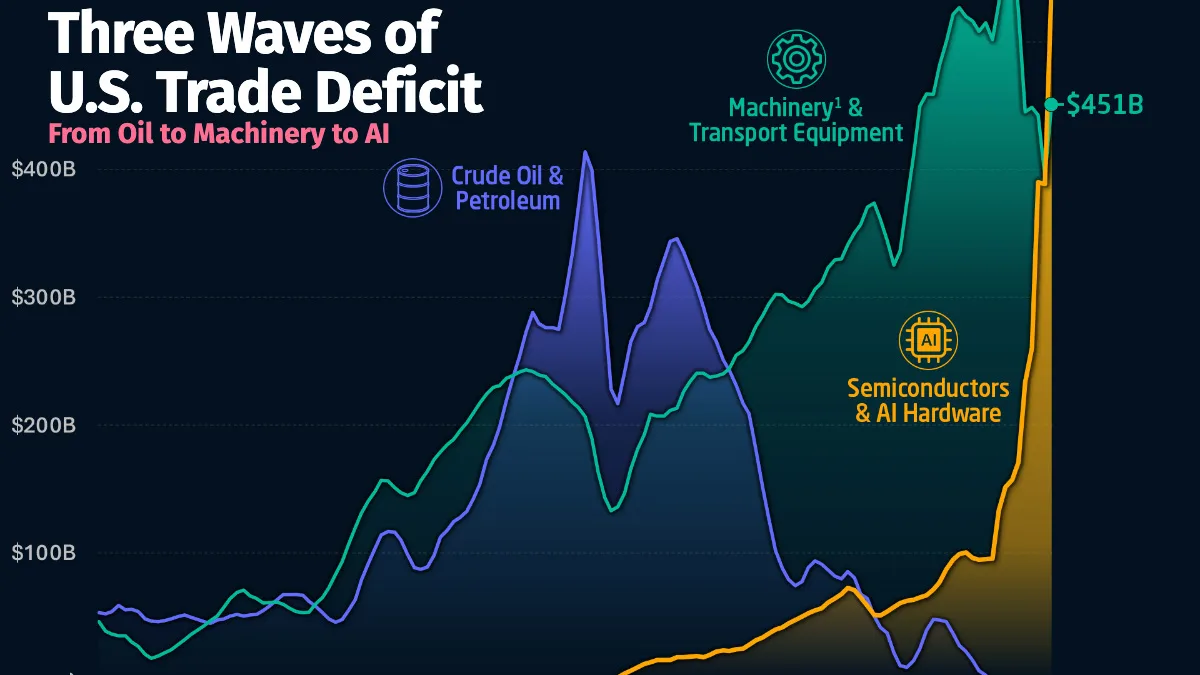
Charted: The Three Waves of the U.S. Trade Deficit (1990–2026)
The U.S. trade deficit in semiconductors and AI hardware hit an annualized $546 billion in Q2 2026, overtaking machinery and oil's 2008 peak.
Mapped: Unemployment Rates in Every U.S. State in 2026
The U.S. has nearly four percent unemployment in 2026. West Coast states like California drive up the national average.
Ranked: 125 European Cities by Quality of Life and Cost
Which European cities offer the best quality of life for the lowest cost? Explore 125 cities ranked by affordability and livability.
Mapped: What a Home Is Worth in Every U.S. State in 2026
A typical home in Hawaii is worth $833,000, more than four times one in West Virginia. See how home values compare in every U.S. state.