
Ranked: The World’s Best and Worst Cities for the Environment
Environmental quality by city in 2026: See which cities lead and lag across air quality, emissions, and environmental risk.
Which Cities Have the Best and Worst Environments?
Key Takeaways
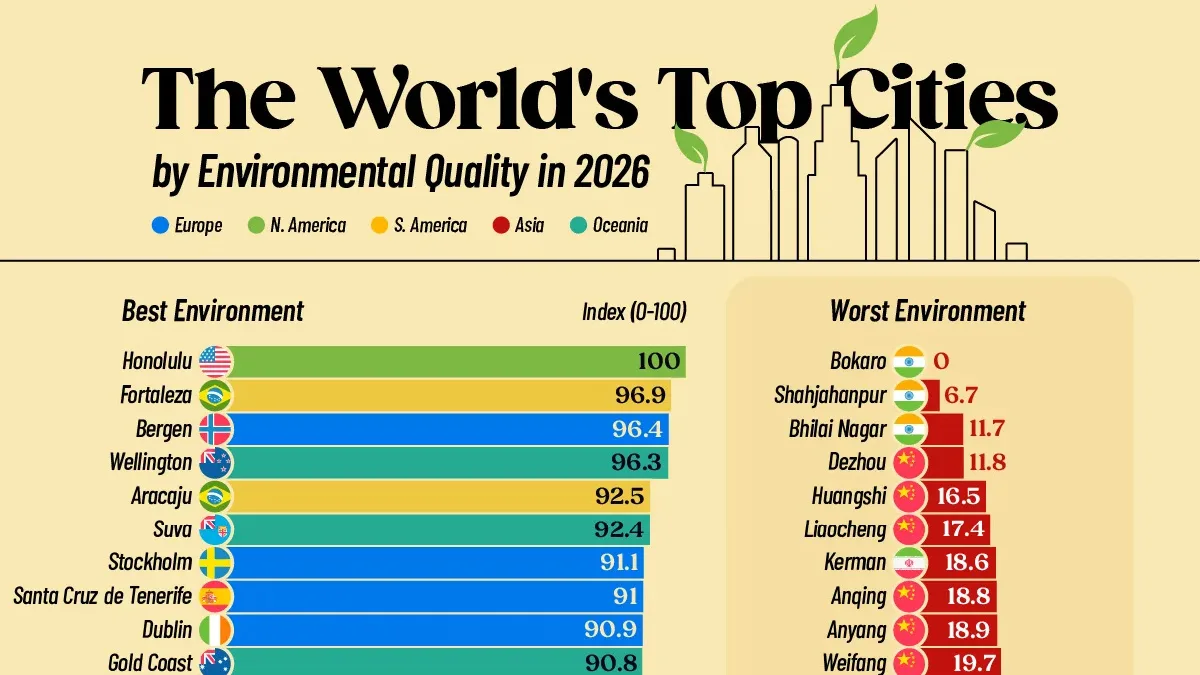
Honolulu ranks first for environmental quality with a score of 100, followed by Fortaleza, Brazil, and Bergen, Norway.
Brazil places nine cities in the global top 30, more than any other country.
All 30 of the lowest-ranked cities are in Asia, including 23 in China.
Where do the world’s cities rank when it comes to environmental quality?
This visualization ranks the world’s best- and worst-performing cities using data from the Oxford Economics Global Cities Index 2026, which evaluates 1,000 cities worldwide.
The environmental index measures factors including air quality, emissions intensity, natural-disaster risk, and temperature and rainfall anomalies. Scores range from 0 to 100, with higher scores indicating stronger environmental performance.
Honolulu Leads the Global Ranking
Honolulu tops the environmental ranking with a score of 100, the highest possible value on the index. Fortaleza, Brazil, follows at 96.9, while Bergen, Norway, ranks third at 96.4.
RankCityRegionEnvironmental Score (0-100)
1 HonoluluNorth America100.0
2 FortalezaSouth America96.9
3 BergenEurope96.4
4 WellingtonOceania96.3
5 AracajuSouth America92.5
6 SuvaOceania92.4
7 StockholmEurope91.1
8 Santa Cruz de TenerifeEurope91.0
9 DublinEurope90.9
10 Gold CoastOceania90.8
11 TeresinaSouth America90.2
12 MalmöEurope90.1
13 RecifeSouth America90.1
14 CopenhagenEurope89.7
15 EdinburghEurope89.7
16 RennesEurope89.5
17 NatalSouth America89.4
18 João PessoaSouth America89.1
19 GlasgowEurope89.0
20 San JuanNorth America88.9
21 BridgetownNorth America88.8
22 Las PalmasEurope88.7
23 BelémSouth America88.5
24 MaceióSouth America88.5
25 Las VegasNorth America88.3
26 SalvadorSouth America88.3
27 SeattleNorth America88.1
28 AberdeenEurope88.1
29 VancouverNorth America88.0
30 NassauNorth America87.9
Ocean winds can help disperse air pollution in coastal cities, potentially contributing to Honolulu’s strong environmental performance. The city also benefits from relatively clean air compared with many large urban centers.
However, a top environmental score does not mean a city is free from climate-related risks. Oʻahu remains exposed to flooding, hurricanes, coastal erosion, and other hazards, and the city has adopted climate action and resilience plans aimed at reducing emissions and preparing for these threats.
Brazil Has Nine Cities in the Top 30
Fortaleza leads Brazil’s nine entries with a score of 96.9, followed by Aracaju at 92.5. Teresina, Recife, Natal, João Pessoa, Belém, Maceió, and Salvador also make the list.
Several of these cities are located along Brazil’s northeastern Atlantic coast, where persistent trade winds can help disperse air pollutants. Rainfall can also help remove particulate matter from the atmosphere.
Compared with Brazil’s more heavily industrialized South and Southeast, the Northeast has historically had a lower concentration of heavy industry, potentially limiting some sources of urban air pollution. However, the index also incorporates climate and natural-disaster measures, so no single factor explains these cities’ high scores.
Asian Cities Dominate the Bottom of the Ranking
Bokaro, India, ranks last with a score of zero. Shahjahanpur and Bhilai Nagar, also in India, follow with scores of 6.7 and 11.7, respectively.
Chinese cities account for 23 of the bottom 30 positions, including Dezhou, Huangshi, Liaocheng, Anqing, and Anyang. Five Indian cities also appear in the bottom 30, alongside Kerman in Iran and Khulna in Bangladesh.
RankCityRegionEnvironmental Score (0-100)
1 BokaroAsia0.0
2 ShahjahanpurAsia6.7
3 Bhilai NagarAsia11.7
4 DezhouAsia11.8
5 HuangshiAsia16.5
6 LiaochengAsia17.4
7 KermanAsia18.6
8 AnqingAsia18.8
9 AnyangAsia18.9
10 WeifangAsia19.7
11 FushunAsia20.8
12 HuainanAsia20.8
13 AnshanAsia21.6
14 DatongAsia21.9
15 HezeAsia22.6
16 ZiboAsia22.9
17 XinxiangAsia23.0
18 JiaozuoAsia23.3
19 ZhangjiagangAsia23.3
20 Ma'anshanAsia23.5
21 XingtaiAsia24.5
22 AsansolAsia24.5
23 JilinAsia24.6
24 ZhenjiangAsia24.7
25 KotaAsia24.7
26 HengshuiAsia24.9
27 KhulnaAsia24.9
28 ZaozhuangAsia24.9
29 XiangtanAsia25.3
30 PingdingshanAsia25.8
Factors such as heavy industrial activity, coal-dependent energy use, vehicle pollution, and rapid urban growth can weigh on air quality and environmental performance.
However, the index also considers climate anomalies and natural-disaster exposure, meaning low scores should not be interpreted as a measure of air pollution alone.
Learn More on the Voronoi App
If you enjoyed today’s post, check out The World’s Forest Giants: Who Holds Earth’s Green Wealth? on Voronoi.
Source: https://www.visualcapitalist.com/ranked-the-worlds-best-and-worst-cities-for-the-environment/
Related articles

Fastest-growing plant on Earth could fuel planes and trucks, cut emission 26x vs diesel
Bamboo, the fastest-growing plant on Earth, could be turned into liquid transportation fuel at a...
Over 2,000 responders work to stop grassland fire from Mongolia at Inner Mongolia border
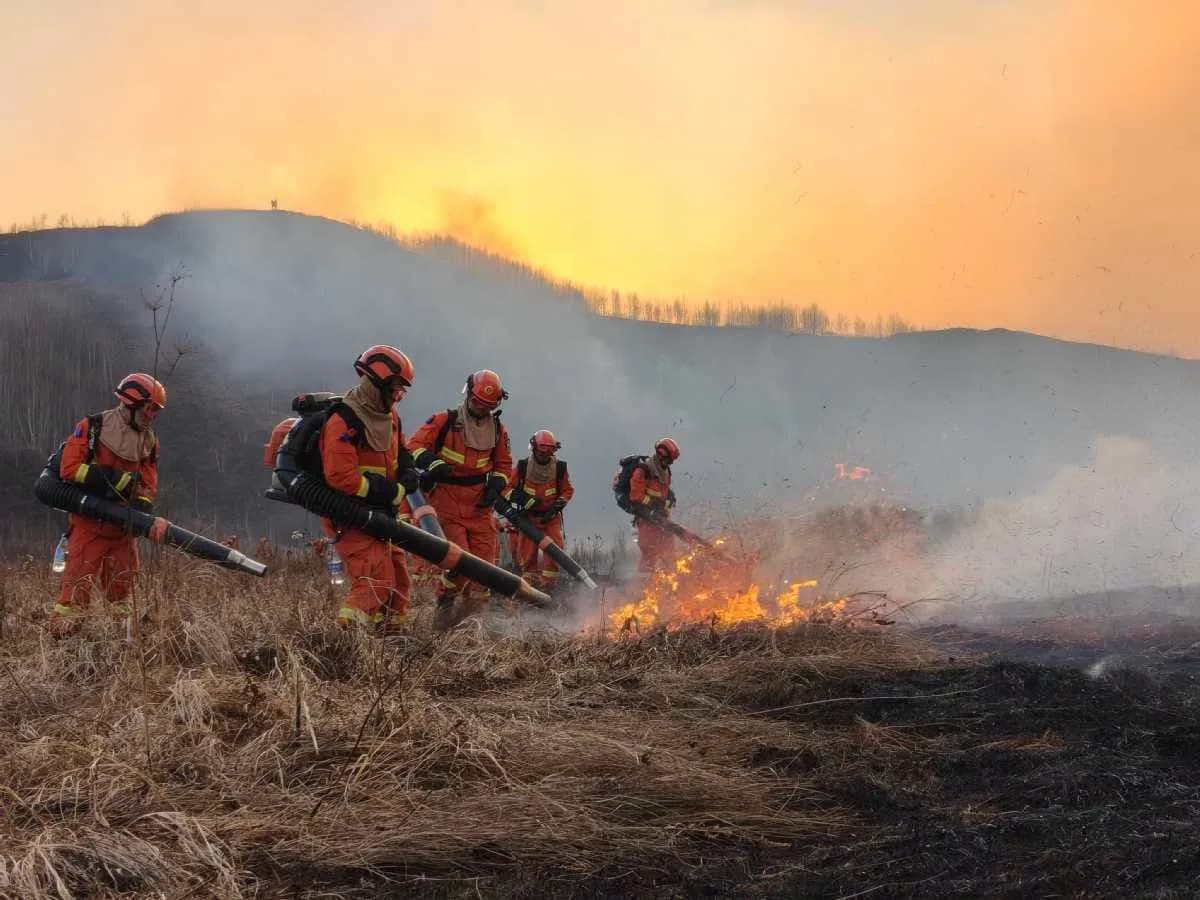
China Daily reports that more than 2,000 firefighters and local responders are trying to keep a grassland fire that started on the Mongolian side on October 9 from crossing into Inner Mongolia.
Numrug protected area fire started by burning Mobicom executives’ vehicle
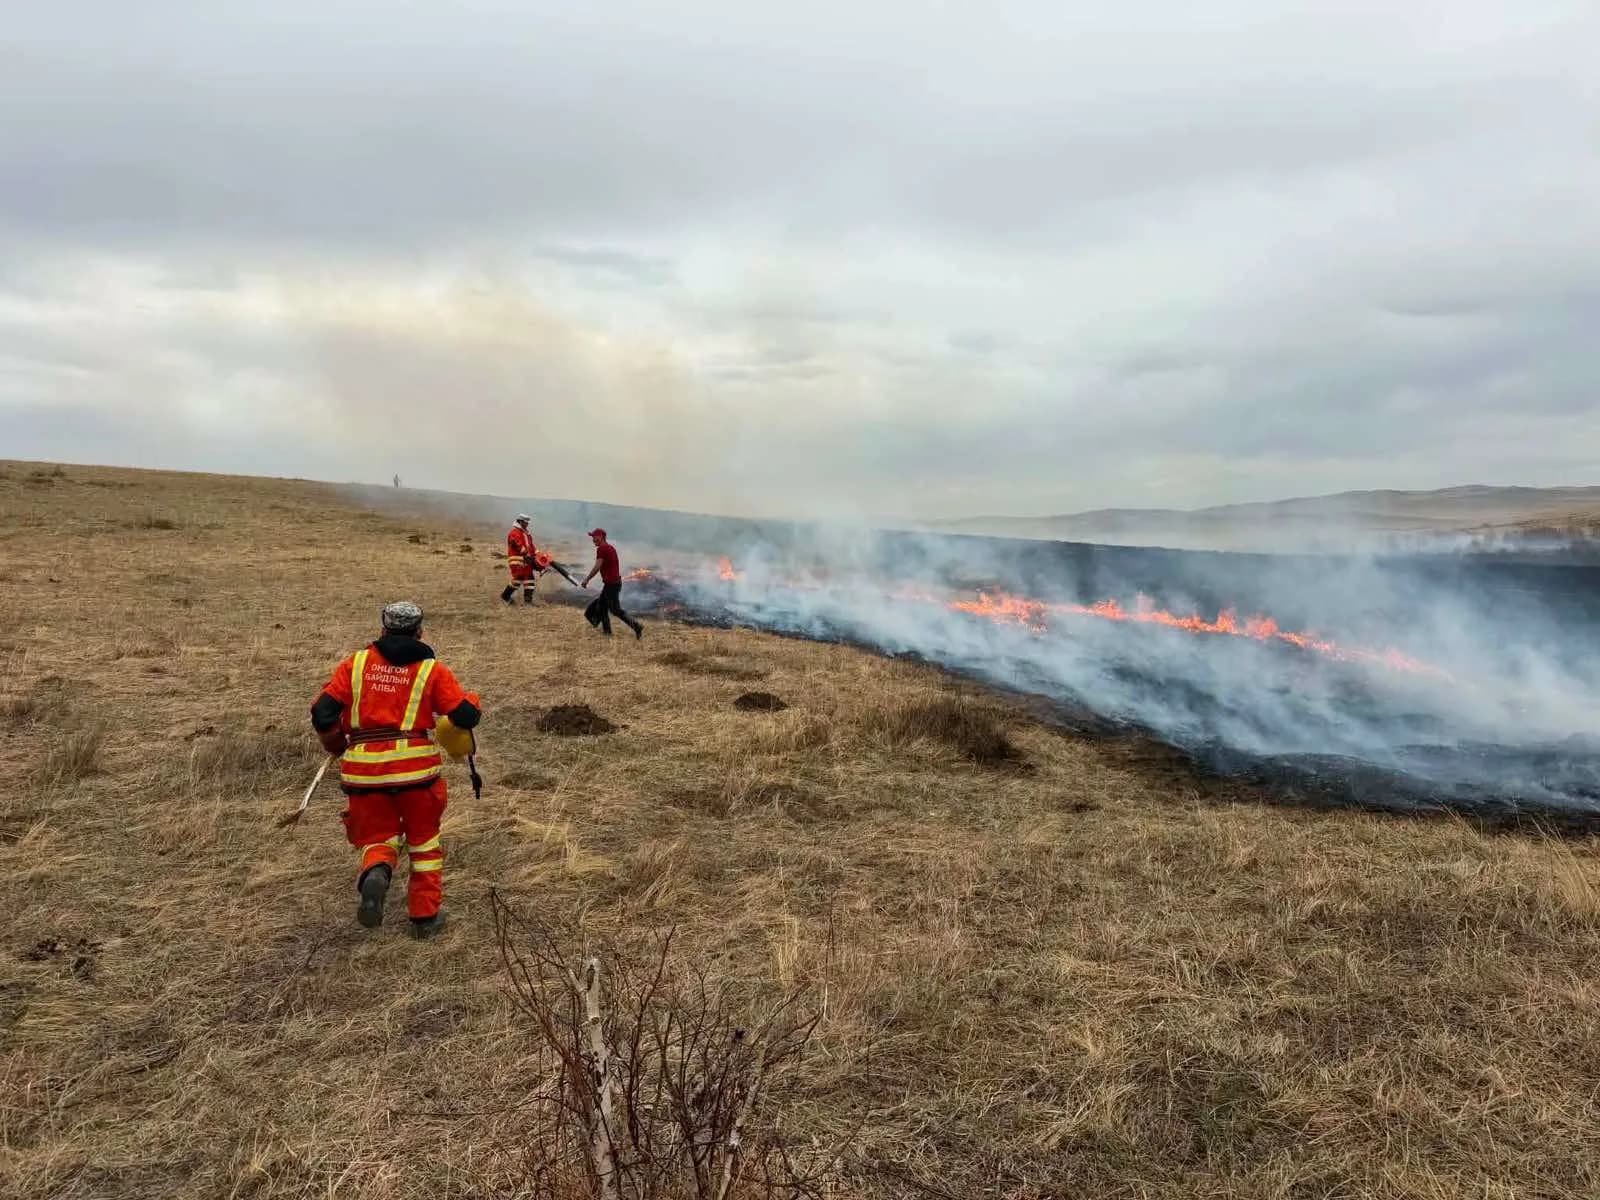
A vehicle carrying Mobicom executives caught fire in Numrug Strictly Protected Area, sparking a wildfire; police will check whether the group hunted.
From wind farms to concrete: Old turbine blades could cut rebar emissions by 90%
Wind turbines spend decades generating clean electricity, but their blades pose a difficult waste problem...
Energy-importing countries record 3x faster clean energy generation than exporters
A new report has revealed that energy-importing countries are scaling clean energy generation three times...
Why plugging ships into the grid can cost more than running onboard generators
A ship can switch off its generators, burn less fuel and reduce pollution while docked,...