
Where America’s 1.2 Million International Students Come From
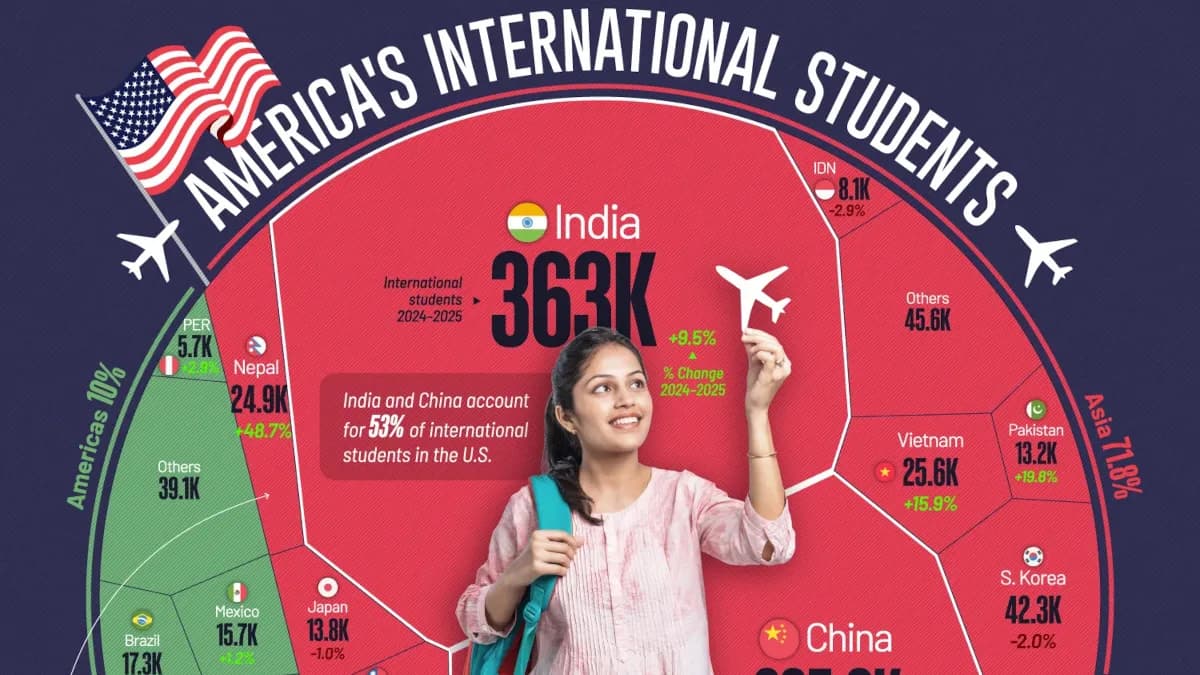
Where do America’s 1.2 million international students come from? India and China lead, as enrollment trends begin to shift.
Where Do America’s 1.2 Million International Students Come From?
Key Takeaways:
India was the largest source of international students in the U.S. in 2024/25, with 363,019 students, followed by China at 265,919.
India and China together accounted for 53% of the international student population, although Indian enrollment rose while Chinese enrollment declined.
More recent data points to a changing pipeline, with new international enrollment falling 17% in fall 2025.
According to the IIE Open Doors 2025 report, 1.18 million international students studied at U.S. colleges and universities in 2024/25, up 5% year-over-year.
That was a record total, equivalent to roughly 6% of U.S. higher education enrollment. The longer-term rise has coincided with immigration becoming an increasingly important component of population growth across many U.S. states.
India Pulls Ahead of China
The following table shows international students by place of origin, based on data from the Institute of International Education.
CountryEnrollment in 2023/24Enrollment in 2024/25% of Total (2024/25)% Change
India331,602363,01930.829.5
China277,398265,91922.58-4.1
South Korea43,14942,2933.59-2.0
Canada28,99829,9032.543.1
Vietnam22,06625,5842.1715.9
Nepal16,74224,8902.1148.7
Taiwan23,15723,2631.980.5
Nigeria20,02921,8471.869.1
Bangladesh17,09920,1561.7117.9
Brazil16,87717,2771.472.4
Mexico15,47415,6521.331.2
Japan13,95913,8141.17-1.0
Pakistan10,98813,1651.1219.8
Ghana9,39412,8251.0936.5
Saudi Arabia14,82812,7021.08-14.3
Iran12,43012,6561.071.8
United Kingdom10,47311,1360.956.3
Colombia10,12010,2130.870.9
Turkey/Türkiye9,1489,4130.802.9
Spain8,8429,2290.784.4
Germany9,2309,1230.77-1.2
France8,5438,6980.741.8
Indonesia8,3488,1040.69-2.9
Italy6,5456,7440.573.0
Peru5,5055,6670.482.9
Hong Kong5,6275,4920.47-2.4
Kenya4,5075,3370.4518.4
Thailand5,3105,0220.43-5.4
Kuwait5,1025,0180.43-1.6
Russia5,0714,9480.42-2.4
Australia4,4324,6200.394.2
Philippines4,1004,5730.3911.5
Egypt4,2804,5180.385.6
Malaysia4,8164,4850.38-6.9
Singapore4,5744,4490.38-2.7
Venezuela3,9043,8860.33-0.5
Burma3,2223,7440.3216.2
Sri Lanka3,4243,6610.316.9
Jamaica3,1853,4160.297.3
Ethiopia3,0783,3950.2910.3
Argentina3,1013,3350.287.5
Ecuador3,2563,2820.280.8
Kazakhstan2,7123,1020.2614.4
Chile3,1133,0920.26-0.7
South Africa2,8142,9520.254.9
Jordan2,6432,7680.244.7
Bahamas2,5132,7640.2310.0
Zimbabwe1,9072,7120.2342.2
Sweden2,5722,6650.233.6
Greece2,5612,6410.223.1
Honduras2,5322,5480.220.6
Netherlands2,5462,4620.21-3.3
Ukraine2,1832,3460.207.5
Israel2,1672,2660.194.6
Panama2,1282,2330.194.9
Mongolia1,6711,9910.1719.2
Morocco1,7841,9750.1710.7
Lebanon1,9871,8260.16-8.1
Poland1,6611,8090.158.9
United Arab Emirates1,5711,8080.1515.1
Congo, Dem. Rep. of the (Kinshasa)1,7381,7940.153.2
New Zealand1,6961,7810.155.0
Norway1,6921,6170.14-4.4
Dominican Republic1,5421,5820.132.6
Uganda1,3031,4950.1314.7
Bolivia1,3571,4630.127.8
Costa Rica1,4311,4610.122.1
Trinidad and Tobago1,3341,4190.126.4
Ireland1,4231,4040.12-1.3
Oman1,7481,4010.12-19.9
Kyrgyzstan9771,3860.1241.9
El Salvador1,4511,3840.12-4.6
Switzerland1,3831,3820.12-0.1
Rwanda1,3111,3590.123.7
Guatemala1,3521,3440.11-0.6
Azerbaijan1,1301,3290.1117.6
Uzbekistan1,2191,3100.117.5
Cambodia9971,2010.1020.5
Côte d’Ivoire1,1381,1880.104.4
Albania1,1871,1840.10-0.3
Cameroon9811,1810.1020.4
Denmark1,3291,1720.10-11.8
Tanzania1,0271,1400.1011.0
Portugal1,1111,1370.102.3
Belgium1,0371,0590.092.1
Austria1,0171,0430.092.6
Georgia9911,0400.094.9
Romania9029560.086.0
Serbia8949400.085.1
Haiti8838960.081.5
Hungary7588480.0711.9
Czech Republic8038400.074.6
Tunisia7177690.077.3
Zambia5977430.0624.5
Afghanistan7027120.061.4
Nicaragua6186960.0612.6
Paraguay6426650.063.6
Bulgaria5766120.056.3
Malawi5026100.0521.5
Iraq4765720.0520.2
Finland4825430.0512.7
Armenia4975250.045.6
Bosnia and Herzegovina2475170.04109.3
Palestinian Territories4665000.047.3
Senegal5084980.04-2.0
Angola5114780.04-6.5
Sierra Leone3854620.0420.0
Uruguay4204510.047.4
Turkmenistan3804470.0417.6
Cyprus4094380.047.1
Bahrain3354380.0430.7
Syria3854340.0412.7
Gambia, The3634300.0418.5
Algeria3644260.0417.0
Sudan3984170.044.8
Dominica4064140.042.0
Belarus3894110.035.7
Macau4083970.03-2.7
Belize4163820.03-8.2
Croatia3903690.03-5.4
Slovakia3263660.0312.3
Qatar3883500.03-9.8
Guyana3653440.03-5.8
Lithuania3223430.036.5
Libya3653330.03-8.8
Iceland3283200.03-2.4
Burkina Faso2993090.033.3
Botswana2733030.0311.0
Barbados2822960.035.0
Liberia2612900.0211.1
Latvia2622710.023.4
Benin2602670.022.7
Yemen2562580.020.8
Madagascar2402510.024.6
Mali2392490.024.2
Togo2402470.022.9
Mauritius2582390.02-7.4
Slovenia1992360.0218.6
Gabon2502350.02-6.0
Tajikistan1982340.0218.2
Bhutan1842280.0223.9
Bermuda2372280.02-3.8
Burundi1992200.0210.6
Eswatini2102190.024.3
Niger1712190.0228.1
Equatorial Guinea2342170.02-7.3
Saint Lucia1972160.029.6
Estonia1952080.026.7
Saint Kitts and Nevis1932080.027.8
North Macedonia2062050.02-0.5
Grenada1602000.0225.0
Mozambique1751980.0213.1
Tonga1851950.025.4
Kosovo1891900.020.5
Antigua and Barbuda1831860.021.6
Congo, Republic of the (Brazzaville)1801780.02-1.1
Montenegro1481690.0114.2
Fiji1561650.015.8
Cayman Islands1571640.014.5
Moldova1541540.010.0
South Sudan961370.0142.7
Luxembourg1081330.0123.1
Somalia1171280.019.4
Laos1141240.018.8
Papua New Guinea1091180.018.3
Chad661150.0174.2
Saint Vincent and the Grenadines1041120.017.7
Malta72970.0134.7
Namibia82950.0115.9
Cuba117910.01-22.2
Guinea78830.016.4
Sint Maarten72810.0112.5
Eritrea73800.019.6
Samoa76750.01-1.3
Lesotho75700.01-6.7
Aruba58690.0119.0
French Polynesia60660.0110.0
British Virgin Islands45610.0135.6
Palau33580.00575.8
Cabo Verde51570.00511.8
Kiribati61560.005-8.2
Micronesia, Federated States of28520.00485.7
Timor-Leste29470.00462.1
Suriname46450.004-2.2
Maldives33420.00427.3
Turks and Caicos40400.0030.0
Mauritania38370.003-2.6
Curacao50370.003-26.0
Monaco17320.00388.2
Brunei33310.003-6.1
Marshall Islands, Republic of the10300.003200.0
Andorra22280.00227.3
Comoros56220.002-60.7
Cook Islands11180.00263.6
Vanuatu12180.00250.0
Liechtenstein16170.0016.3
Seychelles17160.001-5.9
Djibouti9130.00144.4
Anguilla8120.00150.0
Stateless13120.001-7.7
Central African Republic20110.001-45.0
Guinea-Bissau1190.001-18.2
Martinique780.00114.3
Solomon Islands580.00160.0
Gibraltar1270.001-41.7
Reunion860.001-25.0
Guadeloupe460.00150.0
French Guiana140.0003300.0
Niue140.0003300.0
San Marino230.000350.0
Tuvalu230.000350.0
Europe, Unspecified020.0002—
Montserrat320.0002-33.3
New Caledonia120.0002100.0
São Tomé and Príncipe010.0001—
Saint Helena310.0001-66.7
Wallis and Futuna010.0001—
Falkland Islands/Islas Malvinas200.0000-100.0
World Total1,126,6901,177,766100—
India widened its lead as the largest source of international students in the U.S. Its student population rose 9.5% to 363,019, while China’s fell 4.1% to 265,919.
Nepal (+48.7%), Ghana (+36.5%), and Pakistan (+19.8%) were among the fastest-growing major sources.
A Record Total Masks a Changing Pipeline
Despite the record number of international students in 2024/25, signs of slower growth were already emerging. The overall total was partly supported by Optional Practical Training (OPT), which allows eligible graduates to work temporarily in their field of study. OPT participation jumped 21% to 294,253, while new international enrollment fell 7%.
Indian and Chinese students, among other nationalities, value the U.S. OPT program because it allows eligible graduates to gain work experience after graduation and can provide a pathway toward H-1B sponsorship.
That divergence became more pronounced in fall 2025. IIE’s snapshot of 828 U.S. institutions found that new international enrollment fell 17% from the previous year. Graduate enrollment declined 12%, while undergraduate enrollment rose 2% and OPT participation increased 14%.
Policy and Campus Experience Add Uncertainty
Visa rules are only part of the picture. A 2024 survey cited by the Migration Policy Institute found that 60% of 1,252 Chinese graduate students surveyed reported discrimination on campus. The study focused mainly on students in STEM fields, while many respondents also cited educational quality and life experience as reasons for choosing the United States.
Policy uncertainty has also increased. Recent changes and proposals have included tighter visa screening and restrictions affecting international students, although some measures have faced legal challenges. Along with growing competition from universities abroad, these factors could influence where future international students choose to study.
Learn More on the Voronoi App
For another look at American higher education, see Ranked: Median Student Debt for a U.S. College Degree on the Voronoi app.
Related articles
How Asia Took Over the Global Math Rankings (2003-2025)
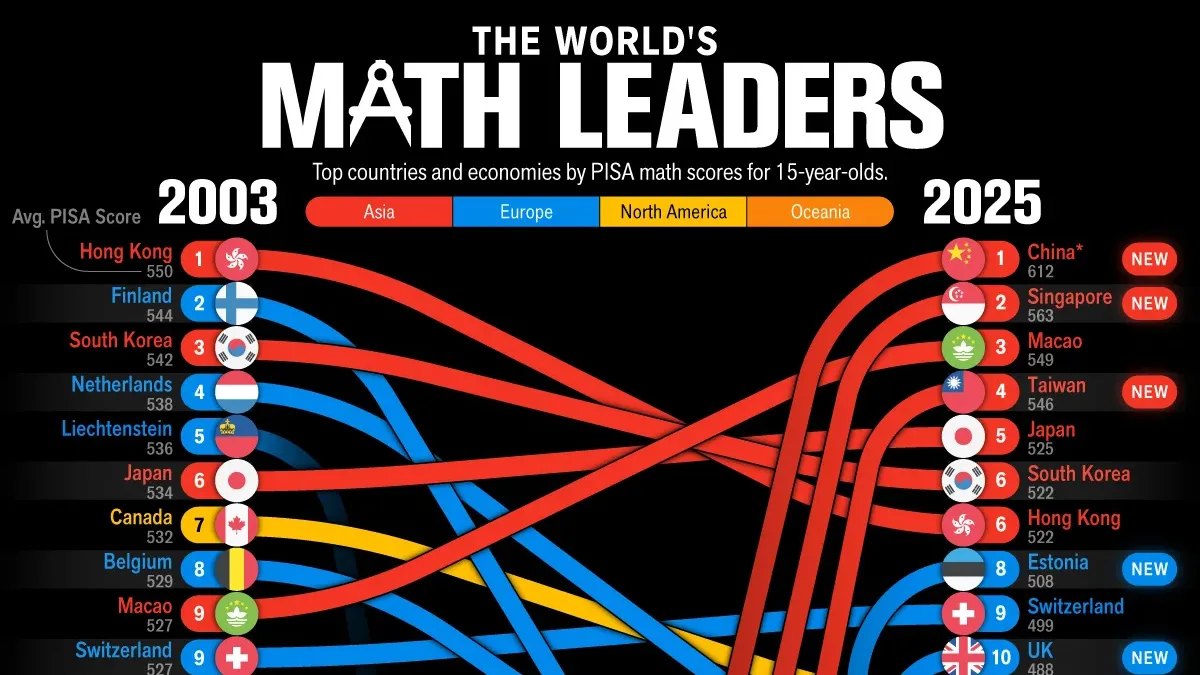
The best countries at math have shifted since 2003, with Asian economies now occupying all seven top spots in PISA.
Mapped: Average Student Debt by State in 2026
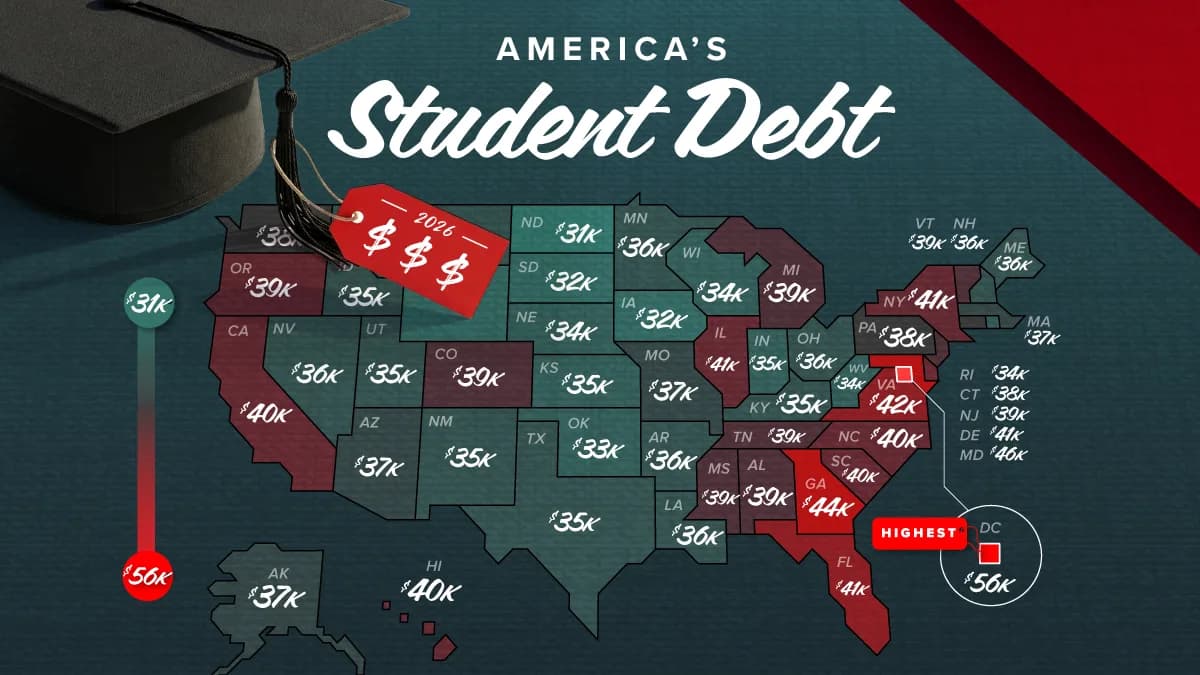
Washington, D.C. may have high salaries, but the average borrower has more student debt there than anywhere else.