Mapped: The Male-to-Female Ratio in Every Country
Explore gender ratios worldwide and why women outnumber men in Eastern Europe while Gulf countries have far more men.
This story was prepared automatically by software.
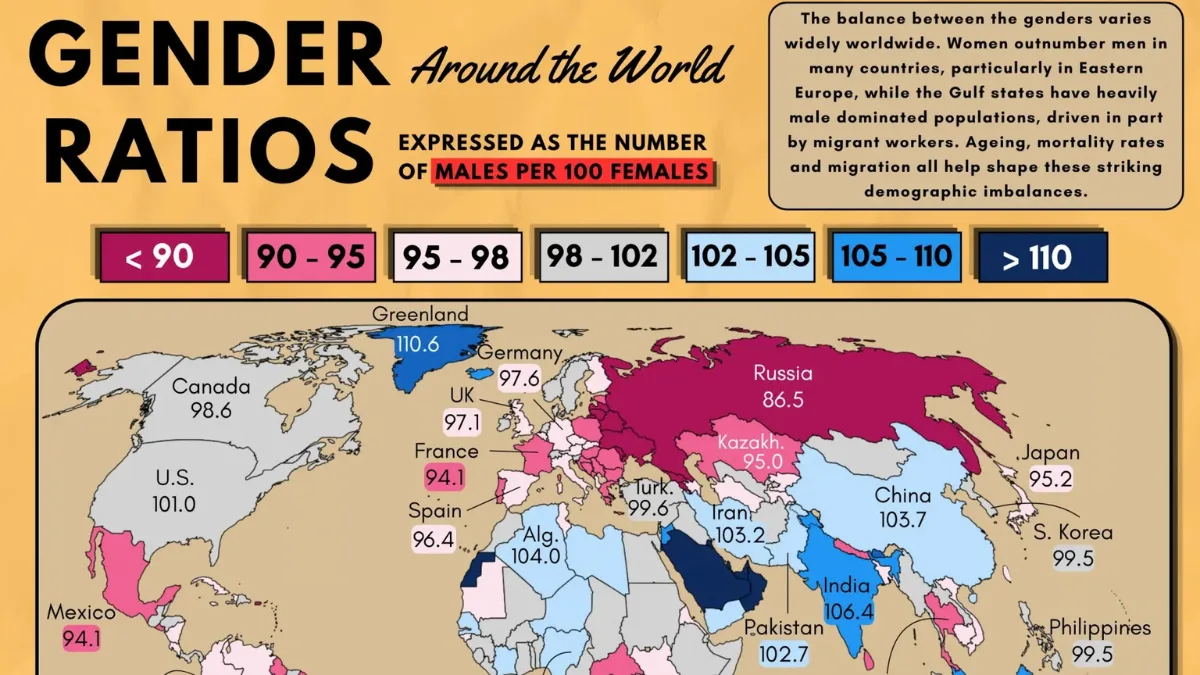
How the Balance Between Men and Women Varies Worldwide
Key Takeaways:
Qatar has the world’s most male-skewed population, with nearly 246 men for every 100 women, largely due to its migrant workforce.
Moldova and Russia are among the most female-skewed countries, with fewer than 87 men per 100 women.
Europe and much of Latin America have female-majority populations, while South Asia, parts of East Asia, and the Middle East generally skew male.
Women generally live longer than men, but that doesn’t mean every country has more women than men. In some countries, men outnumber women by more than two to one.
This visualization by Iswardi Ishak, using 2025 data from the United Nations Population Division Data Portal, maps the number of males per 100 females worldwide. A ratio above 100 indicates more males, while a figure below 100 indicates more females.
Which Countries Have the Biggest Gender Imbalances?
The following table shows the male-to-female population ratios of 237 countries and territories.
The figures reveal striking regional contrasts, from female-majority populations across much of Europe and Latin America to male-skewed populations in parts of Asia and the Middle East.
Country/TerritoryMales per 100 Females
Hong Kong SAR81.8
Guadeloupe82.4
Martinique82.9
Republic of Moldova85.1
Macao SAR85.3
Saint Martin (French part)86.2
Russia86.5
Latvia86.6
Armenia86.6
Ukraine87.0
Belarus87.2
Georgia87.4
Saint Barthélemy88.4
Puerto Rico88.8
Lithuania89.5
Tonga89.5
Aruba89.5
British Virgin Islands89.9
Serbia90.1
United States Virgin Islands90.2
Réunion90.5
El Salvador90.5
Wallis and Futuna Islands90.6
Estonia90.8
Antigua and Barbuda90.9
Bosnia and Herzegovina90.9
Portugal90.9
Curaçao91.0
Nepal91.2
Bahamas91.2
Zimbabwe91.3
Saint Kitts and Nevis91.6
Mayotte91.8
Barbados92.1
Niue92.4
Hungary92.5
Central African Republic92.6
French Guiana92.8
Montenegro92.9
Croatia93.3
Sri Lanka93.7
Bulgaria93.7
Poland93.9
Romania93.9
Greece94.0
France94.1
Mexico94.1
Uruguay94.2
Mozambique94.4
Anguilla94.4
Kiribati94.5
Sint Maarten (Dutch part)94.5
Thailand94.7
Lebanon94.8
South Africa94.8
North Macedonia94.8
Guyana94.8
Kazakhstan95.0
Lesotho95.1
Japan95.2
Malawi95.4
Slovakia95.4
Rwanda95.4
Namibia95.4
Cook Islands95.5
Bermuda95.6
Monaco95.7
Italy95.7
Tokelau95.8
Vietnam96.0
Cambodia96.2
Azerbaijan96.2
Mauritania96.4
Spain96.4
Turkmenistan96.5
Eswatini96.5
Bangladesh96.7
Tajikistan96.7
San Marino96.8
South Sudan96.8
Brazil96.8
Kosovo (under UNSC res. 1244)96.8
Nicaragua96.9
Falkland Islands (Malvinas)97.0
Austria97.0
United Kingdom97.1
Cuba97.3
Czechia97.3
Saint Lucia97.3
Belgium97.4
New Caledonia97.4
Colombia97.4
Saint Pierre and Miquelon97.4
Jersey97.4
Germany97.6
Eritrea97.6
Venezuela (Bolivarian Republic of)97.6
Trinidad and Tobago97.6
Guernsey97.6
Costa Rica97.6
Tunisia97.7
Albania97.7
Kyrgyzstan97.7
Jamaica97.8
Guinea-Bissau97.8
Finland97.8
Haiti97.8
Taiwan97.8
Isle of Man98.0
Angola98.0
Ireland98.0
Zambia98.0
North Korea98.0
Guinea98.1
Djibouti98.2
Sudan98.3
United Republic of Tanzania98.3
Saint Helena98.4
Guatemala98.4
Uganda98.5
Democratic Republic of the Congo98.5
State of Palestine98.5
Australia98.5
Fiji98.5
Argentina98.6
Canada98.6
Micronesia (Fed. States of)98.7
Burundi98.7
Sao Tome and Principe98.7
Montserrat98.7
Netherlands98.8
Switzerland98.8
Chile98.8
Dominican Republic98.8
New Zealand98.8
Liechtenstein98.8
Kenya98.8
Denmark98.8
Peru98.9
Myanmar99.0
Gibraltar99.1
Gambia99.2
Israel99.2
Burkina Faso99.3
Botswana99.3
Mongolia99.3
Cameroon99.3
Ecuador99.4
Mauritius99.5
Sierra Leone99.5
Philippines99.5
South Korea99.5
Türkiye99.6
Liberia99.7
Dominica99.7
Ghana99.7
Suriname99.7
Congo100.0
Panama100.0
Turks and Caicos Islands100.1
Syria100.2
Somalia100.4
Bolivia100.4
Grenada100.4
Ethiopia100.4
Paraguay100.5
Chad100.6
Benin100.6
Madagascar100.6
Cayman Islands100.7
Iraq100.9
Indonesia100.9
Laos101.0
United States of America101.0
World101.1
Comoros101.1
Slovenia101.2
Honduras101.4
Togo101.4
Luxembourg101.4
Cyprus101.5
Samoa101.5
Sweden101.5
Norway101.6
Morocco101.6
American Samoa101.7
Timor-Leste101.7
Belize101.8
Mali101.8
Uzbekistan101.8
Vanuatu101.9
Egypt102.0
Afghanistan102.0
French Polynesia102.2
Nigeria102.4
Guam102.5
Yemen102.7
Pakistan102.7
Gabon102.9
Niger103.1
Senegal103.2
Iran (Islamic Republic of)103.2
Côte d'Ivoire103.4
Libya103.4
Cabo Verde103.5
Saint Vincent and the Grenadines103.5
Republic of Naoero103.6
China103.7
Algeria104.0
Andorra104.5
Solomon Islands104.6
Marshall Islands104.7
Tuvalu104.9
Iceland105.1
Bonaire, Sint Eustatius and Saba105.6
Papua New Guinea105.7
Jordan106.2
India106.4
Faroe Islands106.7
Singapore106.8
Malta108.0
Malaysia109.7
Greenland110.6
Equatorial Guinea111.4
Northern Mariana Islands112.3
Brunei Darussalam113.0
Bhutan114.6
Palau116.5
Western Sahara122.4
Seychelles122.5
Saudi Arabia152.7
Kuwait156.9
Maldives161.1
Bahrain163.4
Oman166.0
United Arab Emirates176.0
Qatar245.9
The scale of these differences is striking. Qatar has 245.9 males per 100 females, followed by the UAE (176.0) and Oman (166.0).
At the other extreme, Hong Kong has just 81.8 males per 100 females, followed by Guadeloupe (82.4) and Martinique (82.9).
Why Do Eastern Europe and Russia Have More Women?
Across Eastern Europe and former Soviet countries, women’s longer life expectancy is amplified by elevated male mortality. Cardiovascular disease, alcohol-related deaths, and historical demographic shocks have all contributed to the imbalance.
Pew Research Center also highlights the lasting demographic consequences of World War II and differences in male and female survival rates.
The imbalance is particularly pronounced among older age groups, where women substantially outnumber men. In countries such as Latvia, Lithuania, and Russia, decades of lower male life expectancy have contributed to some of the world’s most female-skewed populations.
Why Are Gulf Countries So Male-Dominated?
The Persian Gulf presents the opposite pattern. Qatar, the UAE, Kuwait, and Saudi Arabia have exceptionally male-heavy populations because they attract large numbers of predominantly male migrant workers, particularly in construction and infrastructure.
Many of these workers arrive from South Asian countries such as India, Bangladesh, Pakistan, and Nepal, often without their families. This creates an unusually large population of working-age men, pushing national gender ratios far beyond what natural birth patterns would produce.
Elsewhere in Asia, male-skewed populations in countries such as India and China reflect different forces, including historical son preference and sex-selective births. Unlike the Gulf states, these imbalances are driven more by long-term demographic and cultural factors than labor migration.
Learn More on the Voronoi App
To explore another dimension of gender inequality, see Mapped: America’s Gender Earnings Gap by State, which examines differences in earnings between men and women across the United States.
Related articles